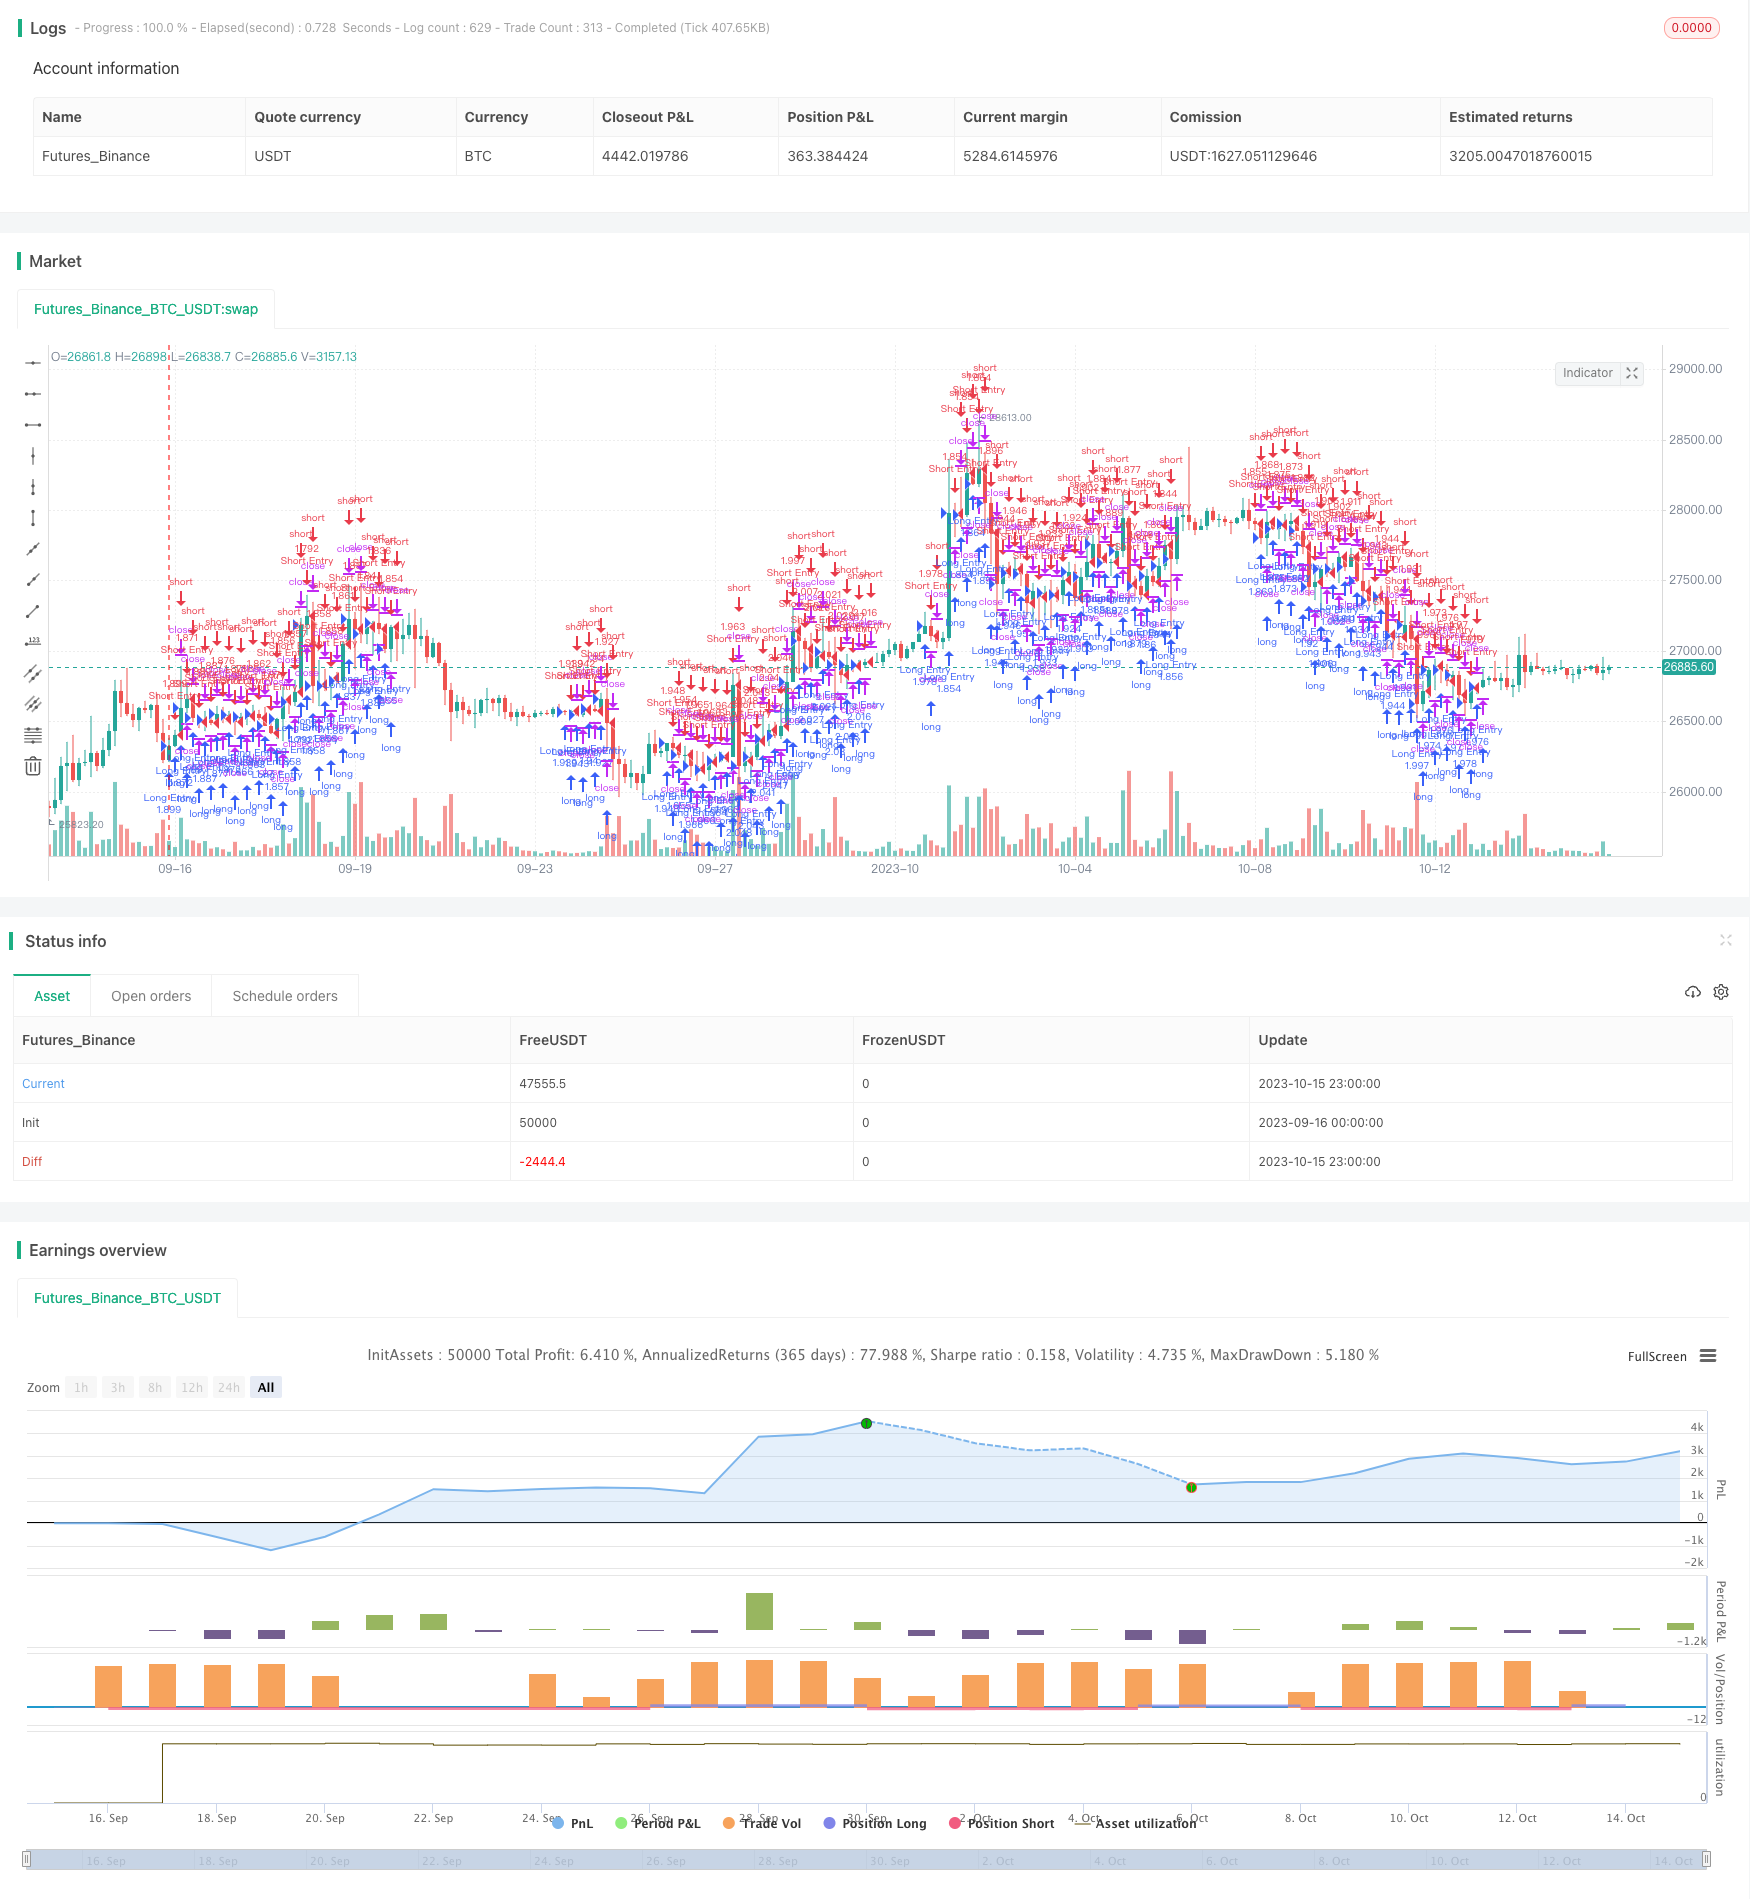
Name
MACD多空平衡跟踪策略MACD-Trend-Balancing-Strategy
Author
ChaoZhang
Strategy Description
[trans]
该策略是一个利用MACD指标识别多空方向的趋势跟踪策略。它通过计算快速移动平均线和慢速移动平均线的差值,生成MACD主线。策略使用MACD主线和信号线的黄金交叉来产生买入信号,死叉来产生卖出信号,实现多空平衡跟踪。
代码首先设置了回测的起止时间,用于测试策略的历史表现。
然后是MACD指标的计算,包括快速移动平均线、慢速移动平均线和MACD均线的长度设置。快速线反应更敏感,慢速线反应更稳定。它们的差值形成MACD主线,再通过均线形成MACD信号线。当差值上穿零轴时产生多头信号,下穿零轴时产生空头信号。
根据多头和空头信号,记录最后一次产生信号的时间。当快线和慢线发生正交时就确认并记录买入/卖出信号,这时就可以开仓了。
进场后,持续跟踪持仓的最高价和最低价。设定一个止损百分比,当亏损达到该百分比时止损退出。
-
MACD指标能有效识别趋势,属于技术分析的经典指标之一。
-
快慢平均线的差值设计,可以提早捕捉到价格变化的动量和方向。
-
利用均线的滤波作用,可以过滤掉部分假信号。
-
策略加入了止损机制来控制风险。
-
MACD指标容易产生假信号,指标本身可优化空间有限。
-
止损点设置不当可能过于活跃或保守,需要针对不同品种单独优化。
-
固定数量头寸容易使杠杆过高,可以考虑根据资金规模设定风险敞口。
-
回测时间窗口选择合理性需要验证,避免过拟合。
-
优化快慢均线参数组合,找到最佳参数对不同品种进行拟合。
-
增加其他指标过滤,如K线形态、布林带、RSI等来验证信号。
-
可以根据回撤、夏普比率等指标评估不同止损点的效果。
-
优化止损策略,如移动止损、挂单止损等方式。
-
尝试根据资金变化、波动率等设定动态仓位。
MACD多空平衡策略是一个基于经典技术指标的趋势跟踪策略。它具有对价格变化动量的敏感捕捉能力,可以通过参数优化很好地适应不同品种。结合更多滤波指标、止损方式以及动态仓位管理,可以继续提升策略的稳定性和盈利能力。
||
This is a trend following strategy that identifies bullish and bearish directions using the MACD indicator. It generates the MACD main line by calculating the difference between fast and slow moving averages. The strategy uses the golden cross of the MACD main line and signal line to generate buy signals, and the death cross to generate sell signals, achieving balanced tracking of trends.
The code first sets the backtesting timeframe to test the historical performance of the strategy.
The MACD indicator is then calculated, including the length settings for the fast moving average, slow moving average, and MACD moving average. The fast line reacts more sensitively and the slow line reacts more steadily. Their difference forms the MACD main line, which is then smoothed by a moving average to form the MACD signal line. When the difference crosses above the zero line, a bullish signal is generated. When it crosses below, a bearish signal is generated.
Based on the bullish and bearish signals, record the last time when a signal was generated. When the fast and slow lines cross, confirm and record the buy/sell signals, then a position can be opened.
After entering a position, continuously track the highest and lowest price of the position. Set a stop loss percentage, when the loss reaches this percentage, exit with a stop loss.
-
The MACD indicator can effectively identify trends and is one of the classic technical indicators.
-
The difference between fast and slow moving averages can early capture price momentum and direction changes.
-
The filtering effect of moving averages helps filter out some false signals.
-
The strategy incorporates a stop loss mechanism to control risks.
-
MACD is prone to generating false signals with limited optimization space.
-
Improper stop loss placement can be too active or conservative, requiring individual optimization across products.
-
Fixed position sizing can easily lead to overleveraging, consider position sizing based on account size.
-
The rationale for backtest timeframes needs to be validated to prevent overfitting.
-
Optimize fast and slow moving average combinations to find best parameters fitting different products.
-
Add other indicators like candlesticks, Bollinger Bands, RSI to filter signals.
-
Evaluate different stop loss levels based on drawdown, Sharpe ratio.
-
Explore stop loss techniques like trailing stop loss, limit orders.
-
Test dynamic position sizing based on equity, volatility.
The MACD trend balancing strategy is based on the classic MACD indicator. It has the ability to sensitively capture price momentum and can be well-adapted to different products through parameter optimization. Further enhancements on filtering signals, stop loss techniques and dynamic position sizing can continue improving the stability and profitability.
[/trans]
Strategy Arguments
| Argument | Default | Description |
|---|---|---|
| v_input_1 | 2017 | Backtest Start Year |
| v_input_2 | true | Backtest Start Month |
| v_input_3 | true | Backtest Start Day |
| v_input_4 | 2019 | Backtest Stop Year |
| v_input_5 | 12 | Backtest Stop Month |
| v_input_6 | 31 | Backtest Stop Day |
| v_input_7 | true | Color Background? |
| v_input_8 | 12 | fastLength |
| v_input_9 | 26 | slowlength |
| v_input_10 | 12 | MACDLength |
| v_input_11 | 5 | Stop Loss % |
Source (PineScript)
/*backtest
start: 2023-09-16 00:00:00
end: 2023-10-16 00:00:00
period: 3h
basePeriod: 15m
exchanges: [{"eid":"Futures_Binance","currency":"BTC_USDT"}]
*/

//@version=2
strategy("MACD BF", overlay=true, initial_capital=10000, default_qty_type=strategy.percent_of_equity, default_qty_value=100, commission_type=strategy.commission.percent, commission_value=0.0)

/////////////// Component Code Start ///////////////
testStartYear = input(2017, "Backtest Start Year")
testStartMonth = input(1, "Backtest Start Month")
testStartDay = input(1, "Backtest Start Day")
testPeriodStart = timestamp(testStartYear,testStartMonth,testStartDay, 0, 0)

testStopYear = input(2019, "Backtest Stop Year")
testStopMonth = input(12, "Backtest Stop Month")
testStopDay = input(31, "Backtest Stop Day")
testPeriodStop = timestamp(testStopYear,testStopMonth,testStopDay, 0, 0)

// A switch to control background coloring of the test period
testPeriodBackground = input(title="Color Background?", type=bool, defval=true)
testPeriodBackgroundColor = testPeriodBackground and (time >= testPeriodStart) and (time <= testPeriodStop) ? #00FF00 : na
bgcolor(testPeriodBackgroundColor, transp=97)

testPeriod() => true

///////////////  MACD Component - Default settings for one day. ///////////////
fastLength = input(12) // 72 for 4hr
slowlength = input(26) // 156 for 4 hr
MACDLength = input(12)  // 12 for 4hr

MACD = ema(close, fastLength) - ema(close, slowlength)
aMACD = ema(MACD, MACDLength)
delta = MACD - aMACD

long = crossover(delta, 0)
short = crossunder(delta, 0)

last_long = long ? time : nz(last_long[1])
last_short = short ? time : nz(last_short[1])

long_signal = crossover(last_long, last_short)
short_signal = crossover(last_short, last_long)

last_open_long_signal = long_signal ? open : nz(last_open_long_signal[1])
last_open_short_signal = short_signal ? open : nz(last_open_short_signal[1])

last_long_signal = long_signal ? time : nz(last_long_signal[1])
last_short_signal = short_signal ? time : nz(last_short_signal[1])

in_long_signal = last_long_signal > last_short_signal
in_short_signal = last_short_signal > last_long_signal

last_high = not in_long_signal ? na : in_long_signal and (na(last_high[1]) or high > nz(last_high[1])) ? high : nz(last_high[1])
last_low = not in_short_signal ? na : in_short_signal and (na(last_low[1]) or low < nz(last_low[1])) ? low : nz(last_low[1])

sl_inp = input(5.0, title='Stop Loss %', type=float)/100

/////////////// Strategy Component ///////////////
// Strategy Entry
if testPeriod()
    strategy.entry("Long Entry",  strategy.long, when=long_signal)
    strategy.entry("Short Entry", strategy.short, when=short_signal)

since_longEntry = barssince(last_open_long_signal != last_open_long_signal[1]) // LONG SL
since_shortEntry = barssince(last_open_short_signal != last_open_short_signal[1]) // SHORT SL

slLong = in_long_signal ? strategy.position_avg_price * (1 - sl_inp) : na
slShort = strategy.position_avg_price * (1 + sl_inp)
long_sl = in_long_signal ? slLong : na
short_sl = in_short_signal ? slShort : na

// Strategy SL Exit
if testPeriod()
    strategy.exit("Long SL", "Long Entry", stop=long_sl, when=since_longEntry > 1)
    strategy.exit("Short SL", "Short Entry", stop=short_sl, when=since_shortEntry > 1)

//plot(strategy.equity, title="equity", color=blue, linewidth=2, style=areabr)
Detail
https://www.fmz.com/strategy/429494
Last Modified
2023-10-17 16:15:53
