Name
MACD指标驱动OBV指标量化交易策略MACD-Indicator-Driven-OBV-Quant-Trading-Strategy
Author
ChaoZhang
Strategy Description
[trans]
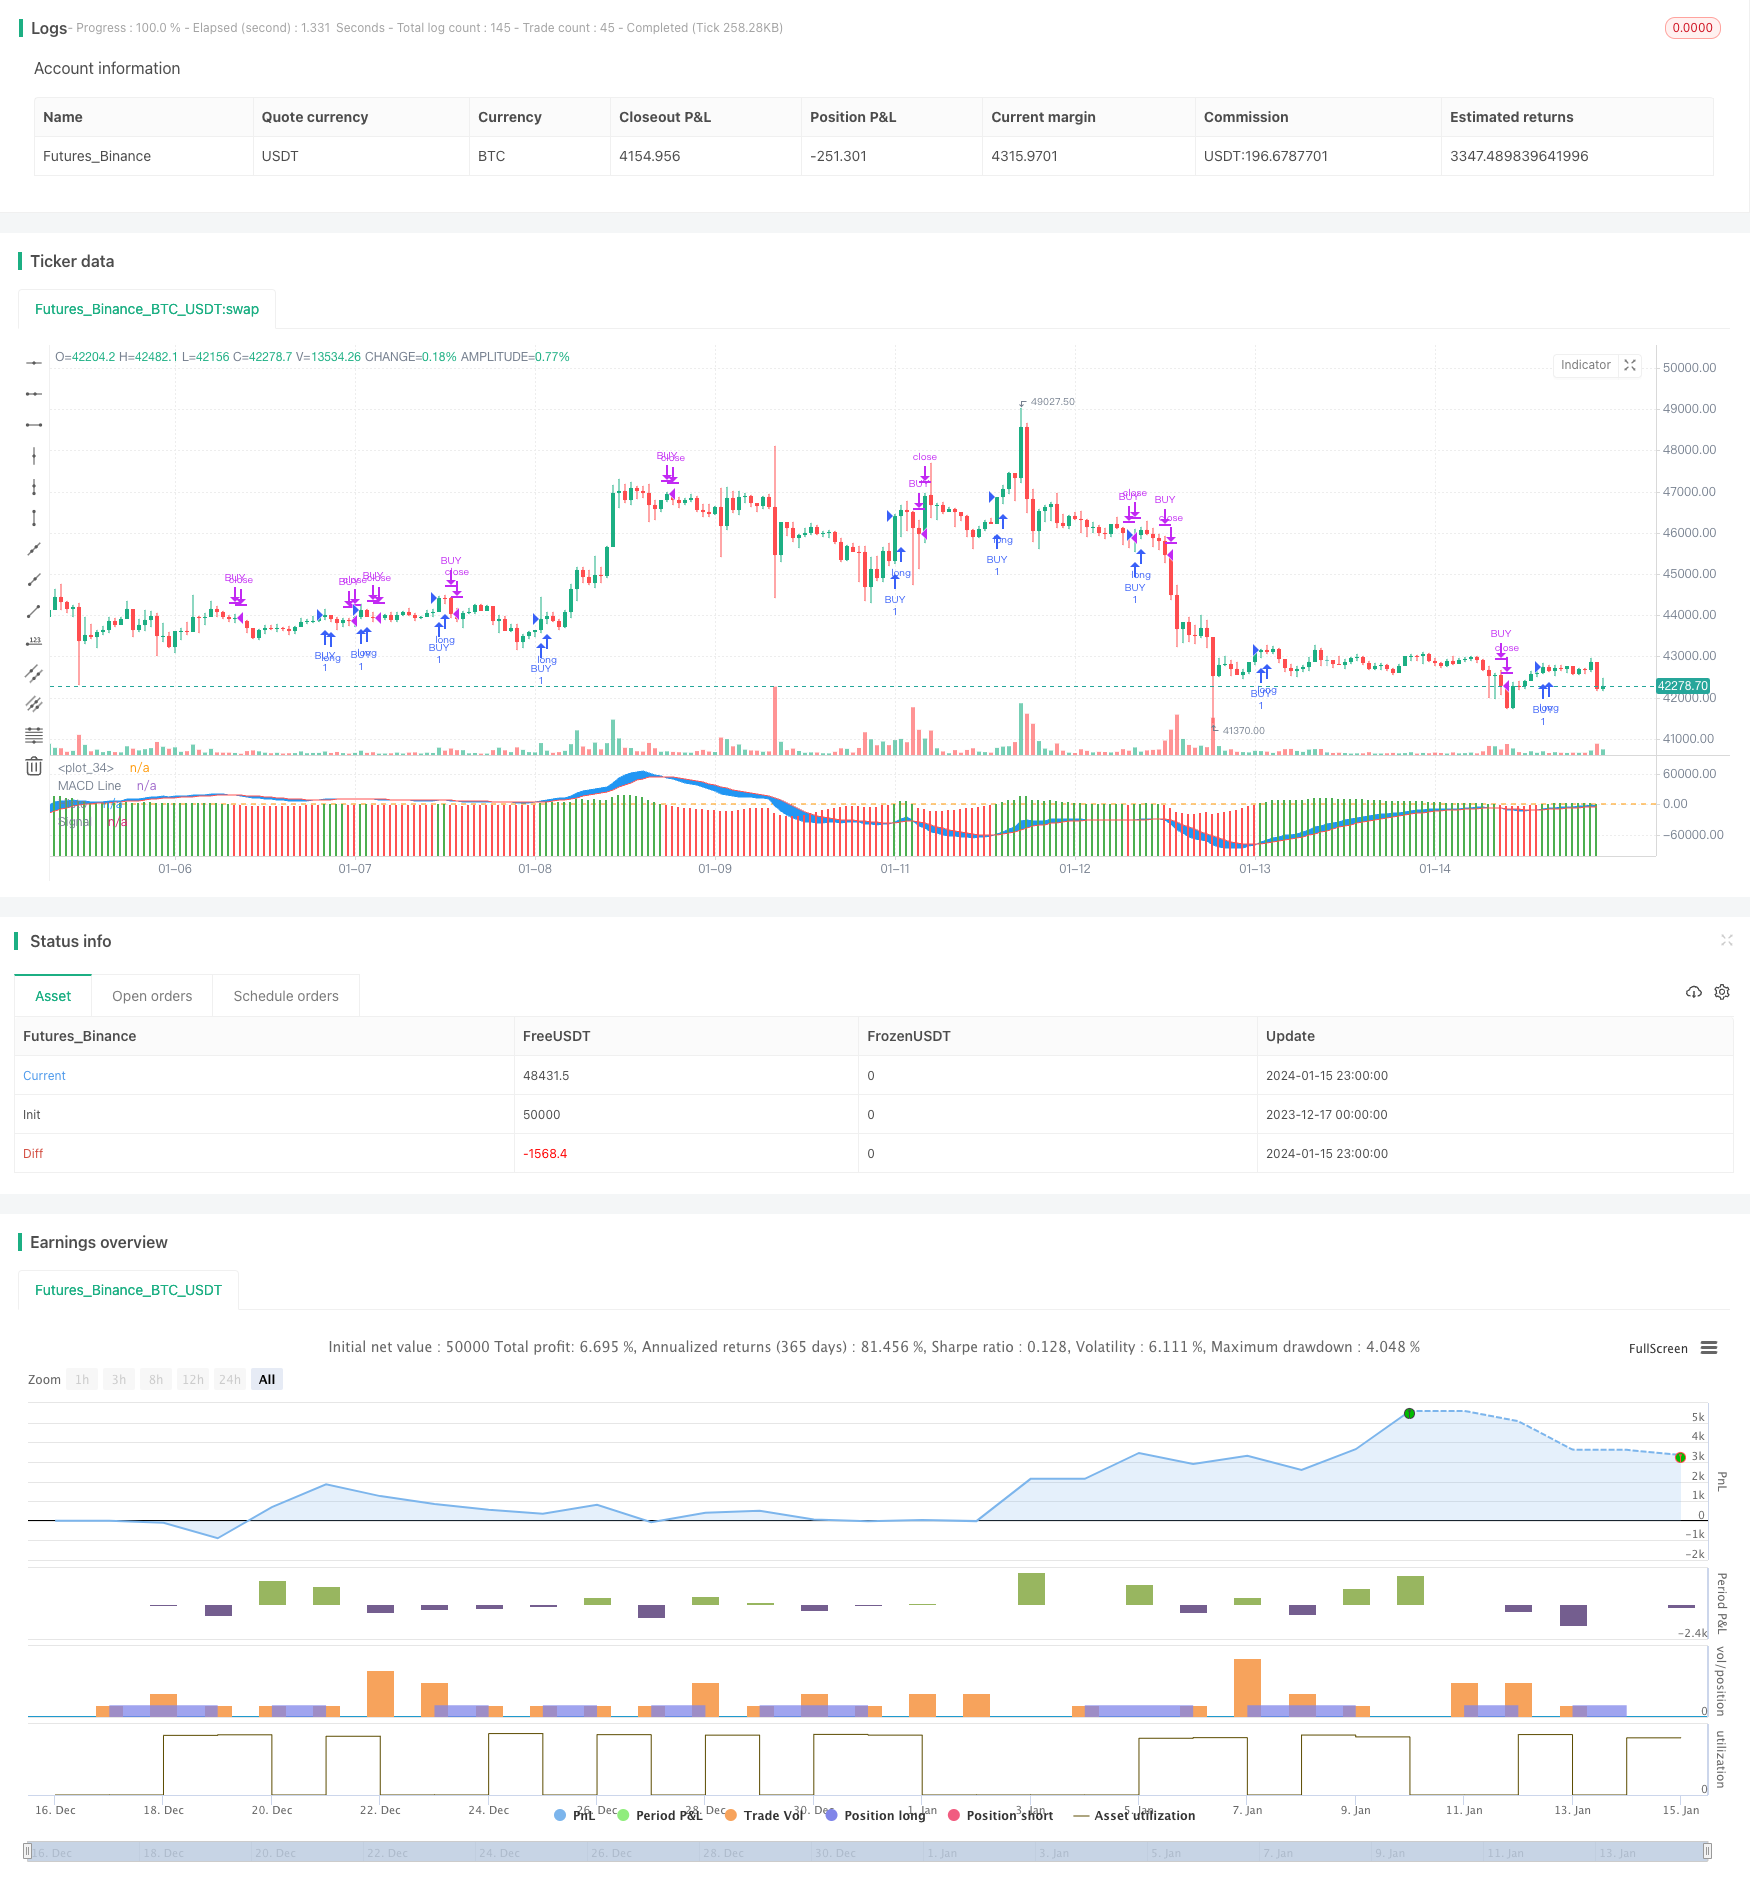
本策略通过计算OBV指标的MACD指标,判断OBV量能的趋势和转折点,以此驱动交易决策。其基本思路是当OBV的MACD柱形图从负数区域突破0轴线而进入正数区域时产生买入信号;而从正数区域跌破0轴线进入负数区域时产生卖出信号。
本策略的核心指标是OBV的MACD指标。OBV指标可以反映股票的量能趋势,它通过统计一段时间内的收盘价变化方向和成交量变化关系,来判断是上涨量能增强还是减弱。MACD指标可以显示不同均线间的差值,反映价格变化的动量。所以,结合OBV量能指标和MACD动量指标,可以更清楚地判断量能的变化趋势。
具体来说,本策略首先计算OBV指标,它通过统计一段时间内收盘价变化方向和成交量的关系,计算出OBV量能线。然后,在OBV量能线的基础上计算其MACD指标,包含MACD线、信号线和histogram柱形图。最后,当macd histogram从负数区域突破0轴线向上进入正数区域时,产生买入信号;当柱形图从正数区域跌破0轴线进入负数区域时,产生卖出信号。
这样,通过MACD直观显示OBV量能的动量特征,判断量能的变化趋势,用MACD的突破来发出交易信号,可以提高交易决策的准确性。
这种策略结合OBV量能分析和MACD动量指标,对量能变化和价格走势判断比较准确,可以有效过滤ALSE信号。具体优势有:
- OBV指标可以判断买卖双方力量对比和量能变化趋势
- MACD柱形图可以清晰识别OBV量能转折点
- 交易信号比较清晰,不易产生误判
- 可配置交易的参数较多,交易规则清晰
该策略也存在一些风险,主要集中在以下几个方面:
- OBV和MACD都对交易量敏感,如果出现异常的高额成交量,会产生误导
- Parameters设置不当也会影响策略效果
- 多空转换时,OBV量能变化可能滞后,导致交易信号滞后
针对这些风险,可以采取以下措施加以应对:
- 对交易量进行过滤,剔除异常数据
- 谨慎设置参数,要考量市场环境
- 适当调整参数设置,如MACD周期,使交易信号及时
本策略还有进一步优化的空间,主要方向有:
- 结合其他指标进行组合交易,提高策略效果
- 增加止损机制来控制风险
- 优化参数设置,使其更符合不同市场环境需要
通过不断测试和优化,本策略可以成为一个稳定而高效的量化交易策略。
本策略是一种典型的结合量能分析和动量指标来判断价格趋势和发出交易信号的量化策略。它可以清晰识别出价格波动的转折点,交易信号比较可靠,在参数设定合理的前提下,可以获得较好的策略效果。但它也存在一些风险,需要通过不断优化来提高效果和降低风险。总的来说,本策略为量化交易策略提供了一种典型的思路,值得进一步研究和应用。
||
This strategy generates trading signals by calculating the MACD indicator of the OBV indicator to determine the trend and inflection points of OBV momentum. The core idea is to generate buy signals when the OBV MACD histogram breaks through the 0-axis from the negative region to the positive region, and to generate sell signals when it breaks through the 0-axis from the positive region to the negative region.
The core indicator of this strategy is the MACD indicator of OBV. The OBV indicator can reflect the momentum trend of a stock by statistically analyzing the relationship between the changing directions of closing prices and trading volumes over a period of time to determine whether the upward momentum is strengthening or weakening. The MACD indicator shows the difference between different moving averages to reflect the momentum of price changes. Therefore, by combining the OBV momentum indicator and the MACD momentum indicator, the change trend of momentum can be more clearly judged.
Specifically, this strategy first calculates the OBV indicator, which calculates the OBV momentum line by statistically analyzing the relationship between the changing directions of closing prices and trading volumes over a period of time. Then, based on the OBV momentum line, its MACD indicator is calculated, including the MACD line, signal line and histogram. Finally, when the macd histogram breaks through the 0-axis from the negative region to the positive region, a buy signal is generated; when the histogram breaks through the 0-axis from the positive region to the negative region, a sell signal is generated.
By this means, the MACD intuitively displays the momentum characteristics of the OBV volume, and judges the trend of volume changes. The penetration of MACD is used to issue transaction signals, which can improve the accuracy of transaction decisions.
This strategy combines OBV volume analysis and MACD momentum indicators for relatively accurate judgments on volume and price trend changes, which can effectively filter out FALSE signals. The specific advantages are:
- OBV indicator can determine the strength contrast between buyers and sellers and the trend of volume changes
- MACD histogram can clearly identify the inflection points of OBV momentum
- Trading signals are clear and less likely to misjudge
- There are more configurable trading parameters and the trading rules are clear
The strategy also has some risks, mainly in the following aspects:
- Both OBV and MACD are sensitive to trading volume. Abnormal high trading volumes can be misleading
- Improper Parameters settings may also affect strategy performance
- When switching between long and short, OBV volume changes may lag, resulting in lagging trading signals
To cope with these risks, the following measures can be taken:
- Filter out abnormal data by screening trading volumes
- Set parameters prudently and take market conditions into consideration
- Properly adjust parameter settings such as MACD cycles to generate timely trading signals
There is still room for further optimization of this strategy, mainly in the following directions:
- Combine with other indicators for portfolio trading to improve strategy performance
- Add stop-loss mechanisms to control risks
- Optimize parameter settings to meet the needs of different market environments
By continuous testing and optimization, this strategy can become a stable and efficient quantitative trading strategy.
This strategy is a typical quantitative strategy that combines volume analysis and momentum indicators to determine price trends and generate trading signals. It can clearly identify the inflection points of price fluctuations, and the trading signals are relatively reliable. With reasonable parameter settings, good strategy results can be obtained. But it also has some risks that need to be reduced by continuous optimization to improve performance. In general, this strategy provides a typical idea for quantitative trading strategies which is worth researching and applying.
[/trans]
Strategy Arguments
| Argument | Default | Description |
|---|---|---|
| v_input_1 | 12 | fastLength |
| v_input_2 | 26 | slowLength |
| v_input_3 | 9 | signalLength |
| v_input_4 | 6 | monthfrom |
| v_input_5 | 12 | monthuntil |
| v_input_6 | true | dayfrom |
| v_input_7 | 31 | dayuntil |
Source (PineScript)
/*backtest
start: 2023-12-17 00:00:00
end: 2024-01-16 00:00:00
period: 1h
basePeriod: 15m
exchanges: [{"eid":"Futures_Binance","currency":"BTC_USDT"}]
*/

//@version=3

strategy(title = "MACD of OBV", overlay = false)

//////////////////////// OBV ///////////////////////////

src = close
obv = cum(change(src) > 0 ? volume : change(src) < 0 ? -volume : 0*volume)


//////////////////////// OBV   //////////////////////////

//////////////// MACD OF OBV ////////////////////////////

sourcemacd = obv

fastLength = input(12, minval=1), slowLength=input(26,minval=1)
signalLength=input(9,minval=1)


fastMA = ema(sourcemacd, fastLength)
slowMA = ema(sourcemacd, slowLength)

macd = fastMA - slowMA
signal = ema(macd, signalLength)
delta=macd-signal

swap1 = delta>0?green:red

plot(delta,color=swap1,style=columns,title='Histo',histbase=0,transp=20)
p1 = plot(macd,color=blue,title='MACD Line')
p2 = plot(signal,color=red,title='Signal')
fill(p1, p2, color=blue)
hline(0)


/////////////////////////MACD OF OBV //////////////////////////


// Conditions


longCond = na
sellCond = na
longCond :=  crossover(delta,0)
sellCond :=  crossunder(delta,0)


monthfrom =input(6)
monthuntil =input(12)
dayfrom=input(1)
dayuntil=input(31)


if (  longCond )
    strategy.entry("BUY", strategy.long, stop=close, oca_name="TREND",  comment="BUY")

else
    strategy.cancel(id="BUY")


if ( sellCond  )

    strategy.close("BUY")
Detail
https://www.fmz.com/strategy/439112
Last Modified
2024-01-17 18:01:36
