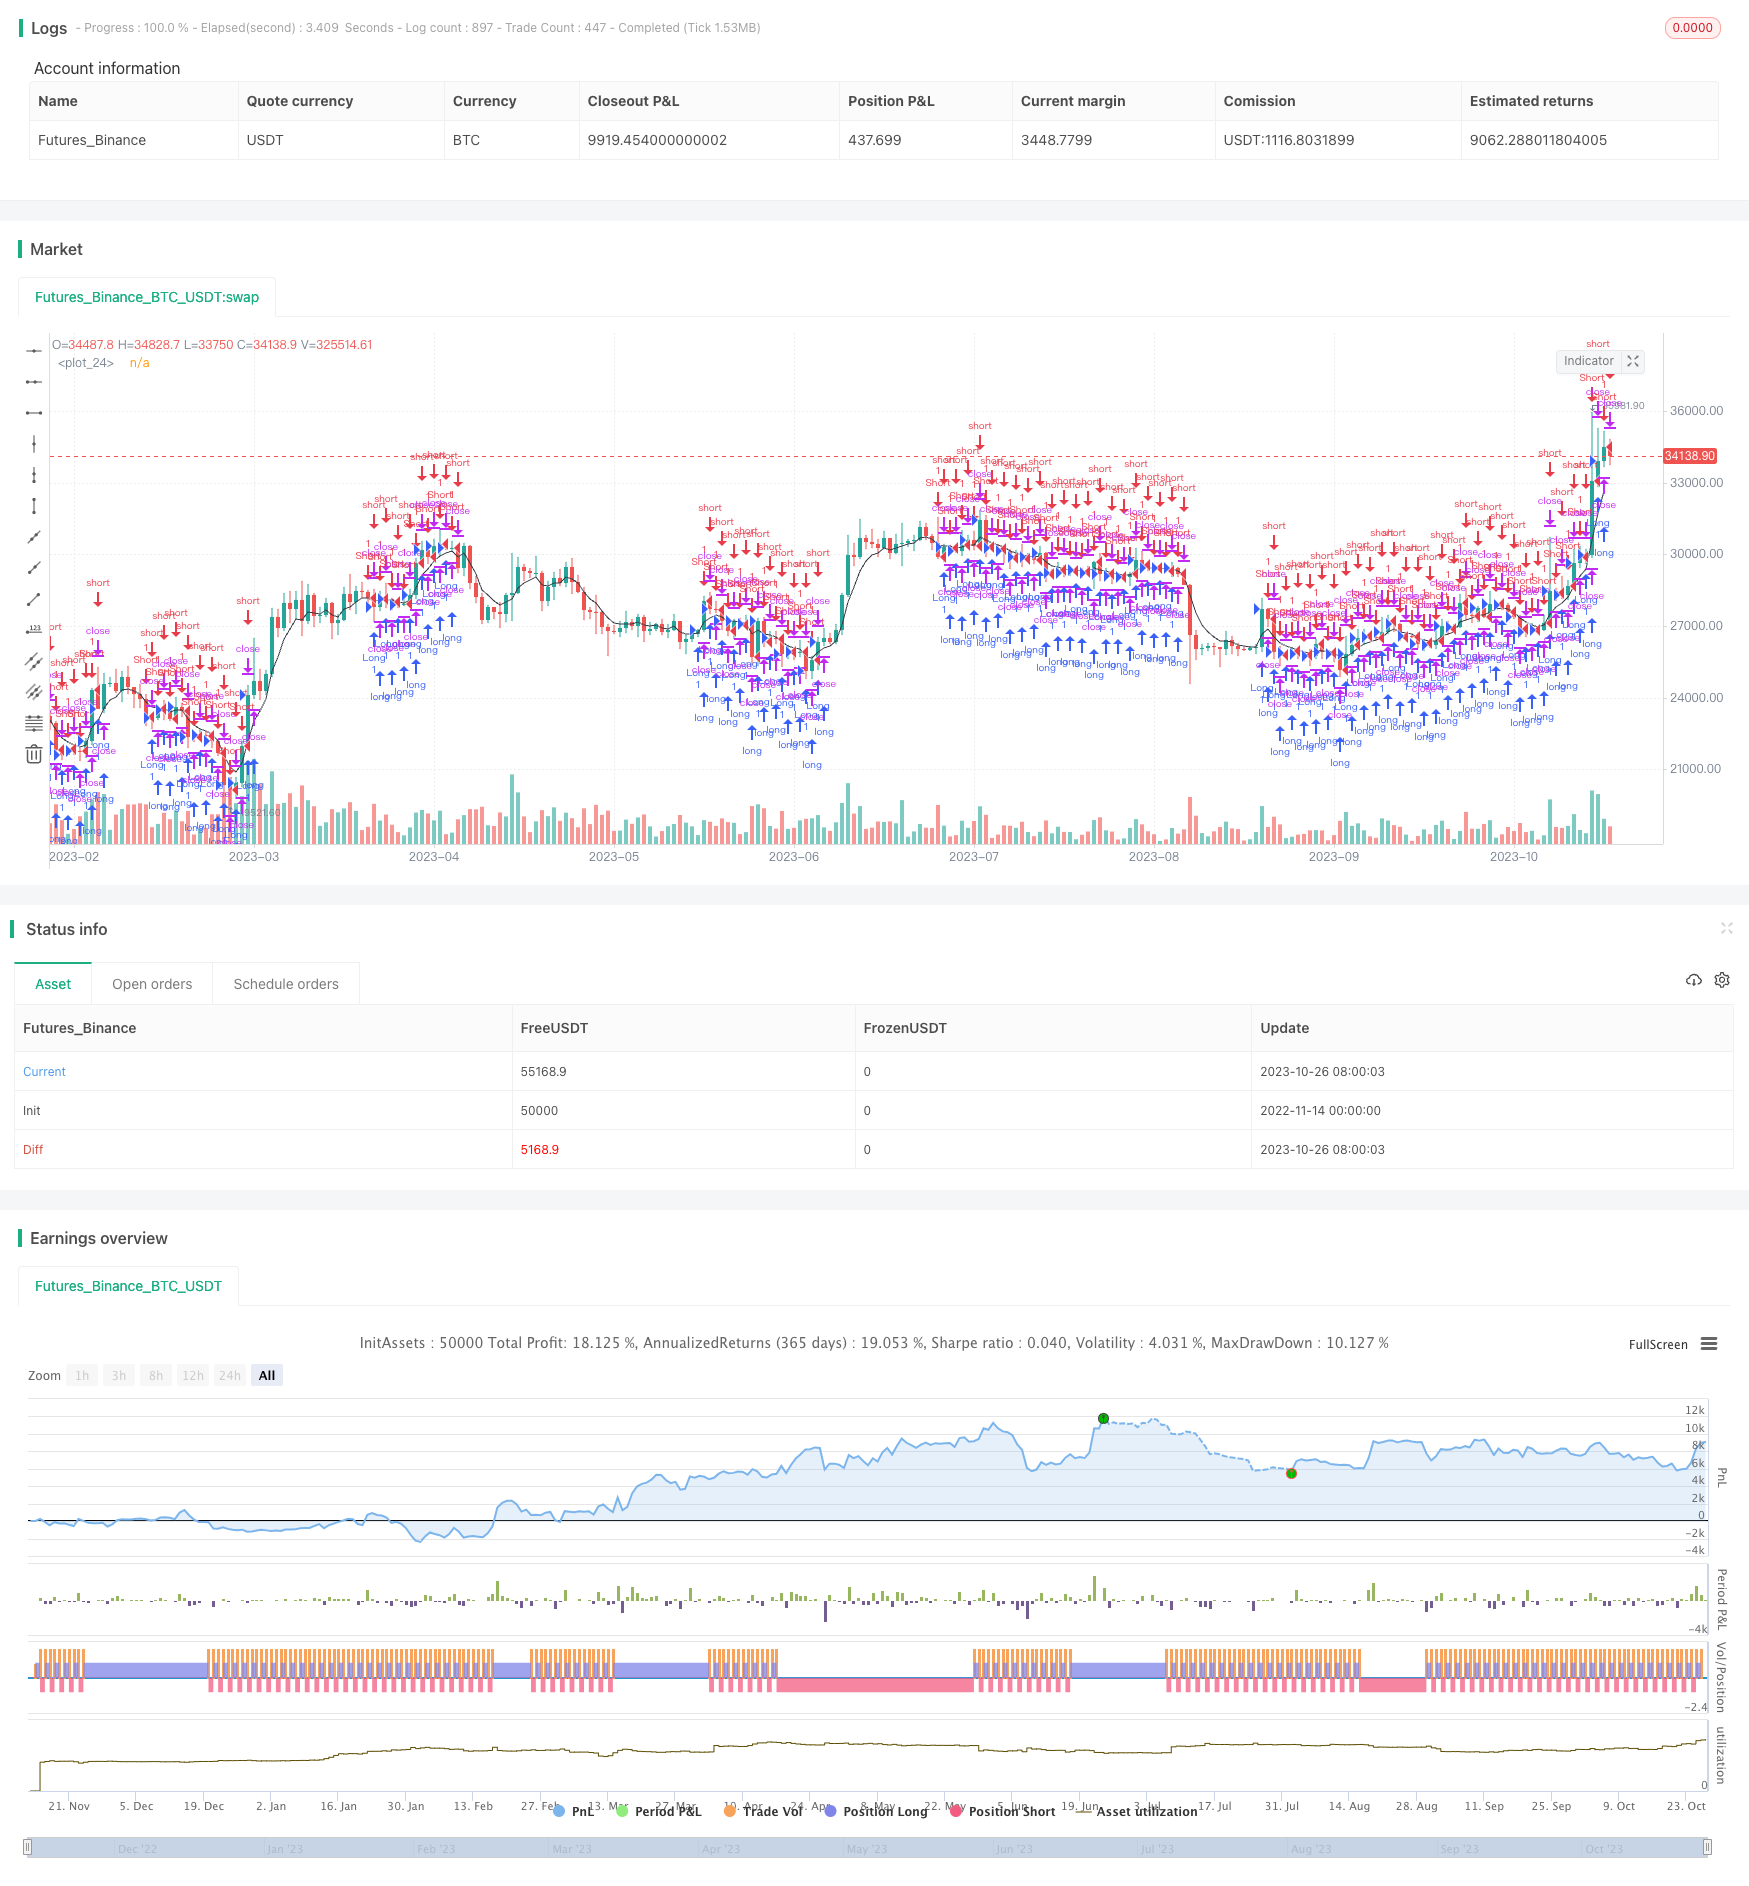
Name
MACD-趋势跟随策略MACD-Trend-Following-Strategy
Author
ChaoZhang
Strategy Description
本策略名称为MACD趋势跟随策略,它是一个利用MACD指标判断价格趋势,并跟随趋势进行交易的量化策略。该策略旨在捕捉中长期趋势,在趋势发生转折时及时调整仓位。
该策略使用MACD指标判断价格趋势。MACD指标是一种突破指标,由快线EMA(12日)和慢线EMA(26日)组成,它们的差离值构成MACD柱状线,该柱状线的9日EMA构成MACD的信号线。当MACD线上穿信号线时为金叉,说明价格处于上涨趋势;当MACD线下穿信号线时为死叉,说明价格处于下跌趋势。
该策略先计算出MACD线和信号线,然后计算出MACD线与信号线的差值delta。当delta上穿0时产生买入信号,当delta下穿0时产生卖出信号,根据这两个信号调整仓位。为过滤噪音,策略还引入了一个EMA均线,只有当价格突破该均线时才会产生真正的交易信号。
具体来说,策略逻辑如下:
- 计算MACD线、信号线和差值delta
- 判断delta上穿或下穿0时,确认趋势转折
- 计算EMA均线,作为过滤器
- 当delta上穿0且价格高于EMA时,产生买入信号
- 当delta下穿0且价格低于EMA时,产生卖出信号
通过这样的设计,该策略能够顺应中长线趋势进行交易,在趋势发生转变时及时调整仓位,避免被短期市场噪音误导。
该策略具有以下几点优势:
- 使用MACD判断趋势转折点,准确判定买入和卖出时机
- 采用EMA过滤器,避免被短期市场噪音干扰
- 只跟随中长线趋势进行交易,避免被震荡市场套牢
- 交易逻辑简单清晰,代码容易理解和修改
- 可以通过参数调整自由控制策略的交易频率
- 资金利用率高,可以充分跟踪中长线趋势
该策略也存在一些风险需要注意:
- MACD作为趋势跟随指标,在震荡行情中容易产生错误信号
- EMA滤波器可能过滤掉部分有效交易机会
- 参数设置不当可能导致交易频率过高或过低
- 无法响应短期市场变化,对突发事件反应不敏感
- 存在一定的滞后,可能错过趋势转折的最佳时间点
对策:
- 优化参数,调整EMA滤波器参数减少误判
- 结合其他指标作为辅助,发现更多交易机会
- 设置止损来控制单笔损失
- 适当缩短持仓时间,保证策略的灵活性
该策略还可以从以下几个方面进行优化:
- 增加其他指标判断,形成指标组合,提高准确率
- 添加止盈止损机制,更好控制风险
- 结合交易量指标,避免虚假突破
- 根据市场环境自适应调整参数,提高策略的适应性
- 优化买入和卖出的具体逻辑,改进进入和退出的时机
- 分阶段建仓,更好跟踪趋势,降低风险
通过指标组合、止损止盈、自适应参数等方法的优化,可以大幅提升该策略的效果。
总体来说,该MACD趋势跟随策略通过简单有效的MACD指标判断中长线趋势,设计了较为清晰的趋势跟随交易逻辑。它具有捕捉趋势的能力,以及一定的风险控制措施。通过进一步的优化和改进,该策略可以成为一个非常实用的量化交易系统。它适用于追求长线稳定收益而非短期盈利的投资者。 ||
This strategy is named the MACD Trend Following Strategy. It is a quantitative strategy that utilizes the MACD indicator to determine price trends and follows the trends to trade. The strategy aims to capture mid-to-long-term trends and adjust positions in a timely manner when trend reversals occur.
The strategy uses the MACD indicator to determine price trends. The MACD is a breakout indicator formed by the fast EMA line (12-day) and the slow EMA line (26-day). The difference between these two lines forms the MACD histogram, and the 9-day EMA of the histogram is the MACD signal line. When the MACD line crosses above the signal line, it is a golden cross, indicating an upward trend. When the MACD line crosses below the signal line, it is a dead cross, indicating a downward trend.
The strategy first calculates the MACD line and signal line, then computes the difference delta between the two lines. When delta crosses above 0, a buy signal is generated. When delta crosses below 0, a sell signal is generated. Based on these two signals, the strategy adjusts positions accordingly. To filter out noise, the strategy also introduces an EMA line - valid trade signals are only generated when the price breaks through this EMA line.
Specifically, the strategy logic is:
- Calculate the MACD line, signal line and the difference delta
- Determine if delta crossing above or below 0 signifies a trend reversal
- Compute an EMA line to serve as a filter
- When delta crosses above 0 and price is above EMA, generate buy signal
- When delta crosses below 0 and price is below EMA, generate sell signal
With this design, the strategy is able to follow mid-to-long-term trends and quickly adjust positions when trends reverse. It avoids being misled by short-term market noises.
The strategy has the following advantages:
- Use MACD to accurately detect trend reversal points for entry and exit timing
- Adopt EMA filter to avoid interference from short-term market noises
- Only follow mid-to-long-term trends, avoiding whipsaws in ranging markets
- Simple and clear logic, easy to understand and modify the code
- Flexibility in controlling trading frequency by adjusting parameters
- High capital utilization to fully track mid-to-long-term trends
There are some risks to be mindful of:
- MACD as a trend following indicator can generate false signals in choppy markets
- EMA filter may filter out some valid trading opportunities
- Improper parameter settings may lead to over- or under-trading
- Unable to respond to short-term market changes due to lagging nature
- May miss optimal timing at trend turning points due to lag
Solutions:
- Optimize parameters and adjust EMA filter to reduce false signals
- Incorporate other indicators for confirmation to uncover more trades
- Implement stop loss to control loss on single trades
- Shorten holding period to improve flexibility
The strategy can be further optimized in the following ways:
- Add other indicators to form a combined system for higher accuracy
- Introduce profit taking and stop loss mechanisms for better risk control
- Incorporate volume indicators to avoid false breakouts
- Adapt parameters dynamically based on market conditions to improve robustness
- Refine entry and exit logic to improve timing
- Scale in positions to better follow trends and reduce risk
Significant improvement can be achieved through methods like indicator combos, adaptive parameters, stop loss/profit taking etc.
In summary, the MACD Trend Following Strategy utilizes the simple and effective MACD indicator to identify mid-to-long-term trends, and implements a clear trend following logic. It has the capacity to capture trends as well as reasonable risk control measures. With further optimizations, the strategy can become a very practical quant trading system. It suits investors seeking steady long-term gains over short-term profits.
[/trans]
Strategy Arguments
| Argument | Default | Description |
|---|---|---|
| v_input_1 | true | Long |
| v_input_2 | false | Short |
| v_input_3 | false | Use EMA filter |
| v_input_4 | 5 | EMA filter period |
| v_input_5 | 12 | fastLength |
| v_input_6 | 26 | slowlength |
| v_input_7 | 9 | MACDLength |
Source (PineScript)
/*backtest
start: 2022-11-14 00:00:00
end: 2023-10-27 05:20:00
period: 1d
basePeriod: 1h
exchanges: [{"eid":"Futures_Binance","currency":"BTC_USDT"}]
*/

//@version=2
strategy(title = "Noro's MACD Strategy v1.0", shorttitle = "MACD str 1.0", overlay = true, default_qty_type = strategy.percent_of_equity, default_qty_value=100.0, pyramiding=0)

//Settings
needlong = input(true, defval = true, title = "Long")
needshort = input(false, defval = false, title = "Short")
usefil = input(false, defval = false, title = "Use EMA filter")
lenfil = input(5, defval = 5, minval = 1, maxval = 50, title = "EMA filter period")

fastLength = input(12)
slowlength = input(26)
MACDLength = input(9)

MACD = ema(close, fastLength) - ema(close, slowlength)
aMACD = ema(MACD, MACDLength)
delta = MACD - aMACD

//Signals
ema = ema(close, lenfil)
trend = crossover(delta, 0) == true ? 1 : crossunder(delta, 0) == true ? -1 : trend[1]
up = trend == 1 and (low < ema or usefil == false) ? 1 : 0
dn = trend == -1 and (high > ema or usefil == false) ? 1 : 0

plot(ema, color = black, transp = 0)

if (up == 1)
    strategy.entry("Long", strategy.long, needlong == false ? 0 : na)

if (dn == 1)
    strategy.entry("Short", strategy.short, needshort == false ? 0 : na)
Detail
https://www.fmz.com/strategy/432230
Last Modified
2023-11-15 17:08:15
