Name
MACD-histogram策略MACD-Histogram-Strategy-of-RSI
Author
ChaoZhang
Strategy Description
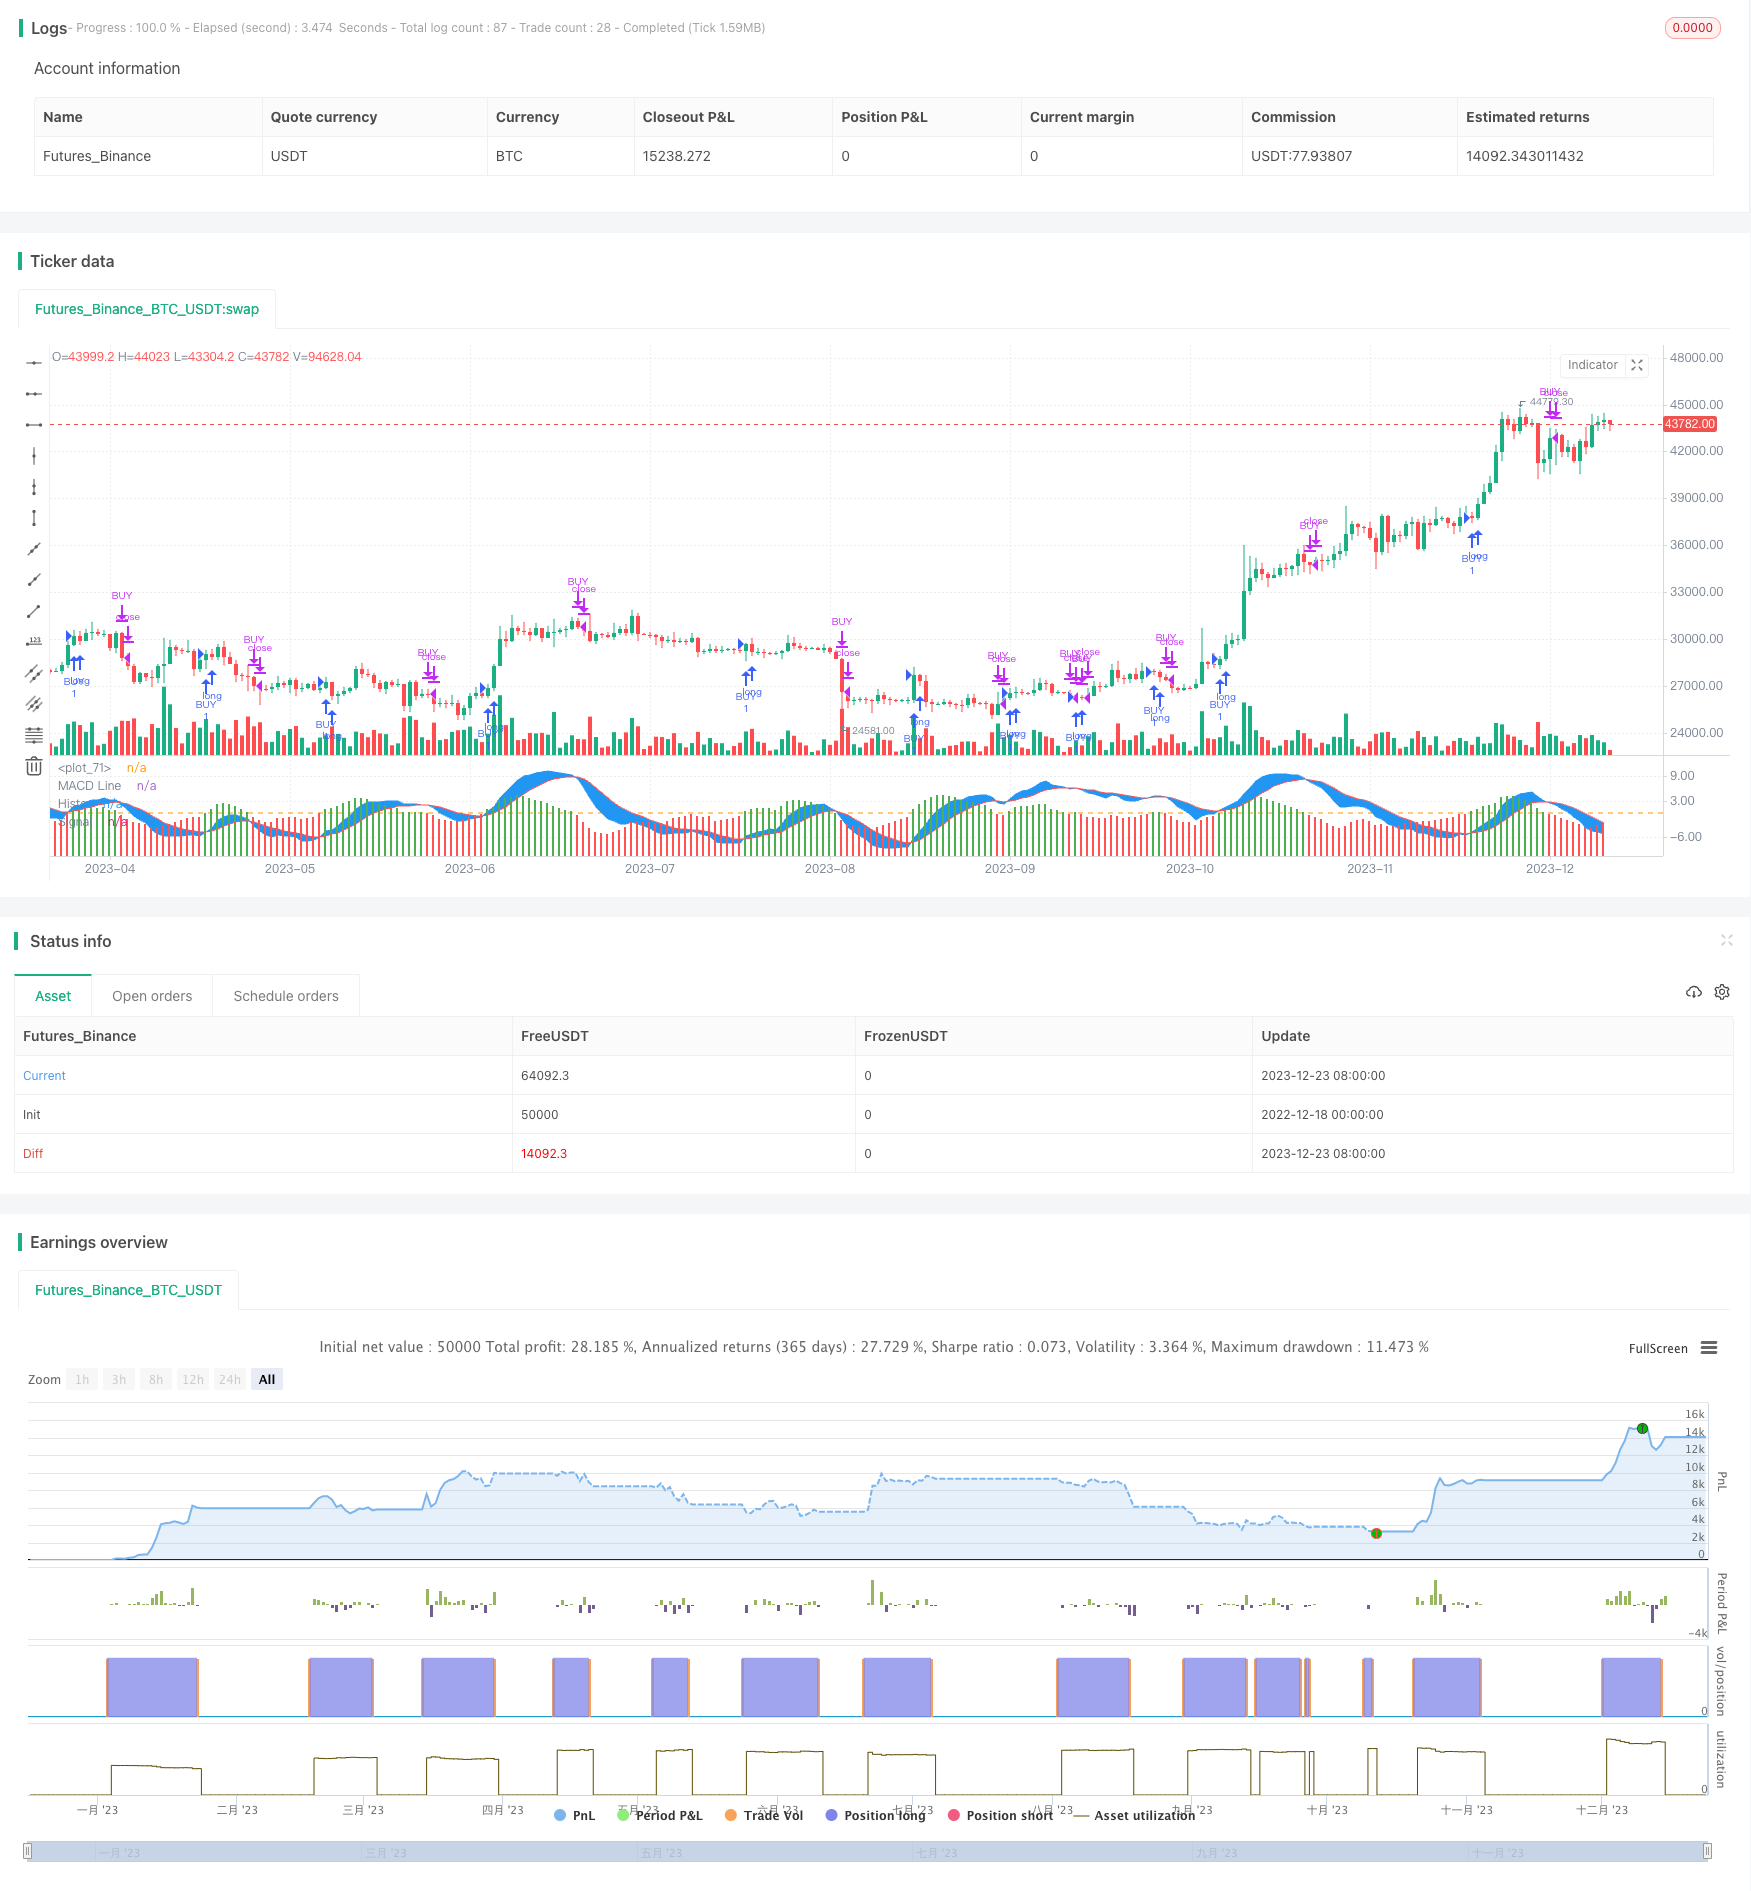
该策略基于RSI指标的MACD进行交易信号生成。它结合了RSI指标判断市场超买超卖的特性,以及MACD判断市场趋势和动量变化的优势,设计出一个综合利用多种指标提供交易信号的策略。
该策略首先计算RSI指标,然后基于RSI指标计算MACD指标。RSI指标能判断市场的超买超卖情况,MACD指标能捕捉市场趋势和动量的变化。
具体来说,策略首先计算14周期的RSI指标。然后基于RSI指标计算MACD指标,包括12周期和26周期的EMA均线,以及9周期的信号线。计算出MACD柱状图。
当MACD柱状图上穿0轴时产生买入信号;当MACD柱状图下穿0轴时产生卖出信号。这样就利用RSI判断市场超买超卖的同时,利用MACD判断市场趋势和动量的变化,进行交易信号的生成。
这种策略结合了RSI和MACD两个指标的优势,可以更全面地判断市场的状态,信号也更加可靠。
-
利用RSI判断超买超卖状态,有助于股票选择和防止假突破。
-
MACD指标判断趋势和动量变化,交易信号更加明确。
-
RSI结合MACD,综合多种因素判断,可以过滤假信号。
-
RSI和MACD的参数设置会影响策略表现,需要调整优化。
-
多指标组合增加了策略复杂度,也增加了出错概率。
-
MACD交易信号可能滞后,需要结合其他指标辅助判断。
-
优化RSI和MACD的参数,找到最佳参数组合。
-
增加其他指标判断,如KDJ、布林带等,形成指标集群,提高信号准确性。
-
加入止损策略,以控制单笔损失。
-
优化开仓和平仓逻辑,防止冲突信号。
该策略综合运用RSI和MACD两个指标的优势,形成交易信号。它判断超买超卖的同时考量趋势和动量因素,可以有效过滤假信号,信号质量较高。下一步通过参数优化、止损策略、以及加入其他指标等手段进一步完善该策略,使其信号更加准确可靠。
||
This strategy generates trading signals based on the MACD of RSI indicator. It combines the RSI indicator's ability to judge overbought and oversold levels in the market, as well as MACD's advantage in determining market trend and momentum changes, to design a strategy that utilizes multiple indicators to provide trading signals.
The strategy first calculates the RSI indicator, then computes the MACD based on the RSI indicator. The RSI indicator can determine the overbought and oversold conditions in the market, while the MACD captures changes in market trend and momentum.
Specifically, the strategy first calculates the 14-period RSI indicator. Then based on the RSI, the MACD indicator is computed, including 12 and 26-period EMAs, as well as a 9-period signal line. The MACD histogram is then calculated.
When the MACD histogram crosses above 0, a buy signal is generated. When the MACD histogram crosses below 0, a sell signal is triggered. This way, the strategy utilizes RSI to judge overbought/oversold levels, while also using MACD to determine trend and momentum changes, to generate trade signals.
This strategy combines the strengths of both RSI and MACD indicators, allowing for a more comprehensive judgment of market conditions, resulting in more reliable signals.
-
Using RSI to judge overbought/oversold levels helps with stock selection and preventing false breakouts.
-
MACD's judgment of trend and momentum changes makes trade signals clearer.
-
The combination of RSI and MACD, with judgments based on multiple factors, helps filter out false signals.
-
Parameter settings for RSI and MACD affect strategy performance and require tuning and optimization.
-
The combination of multiple indicators increases strategy complexity and the probability of errors.
-
MACD trade signals may lag and need to be complemented by other indicators.
-
Optimize RSI and MACD parameters to find best parameter combinations.
-
Incorporate other indicators like KDJ, Bollinger Bands to form an indicator cluster and improve signal accuracy.
-
Incorporate stop loss strategies to control per trade loss.
-
Optimize entry and exit logic to prevent conflicting signals.
This strategy utilizes the combined strengths of RSI and MACD indicators to form trade signals, judging overbought/oversold levels while also considering trend and momentum factors, effectively filtering out false signals and providing quality signals. Next steps involve further enhancements like parameter optimization, stop loss, adding more indicators etc. to improve signal accuracy and reliability.
[/trans]
Strategy Arguments
| Argument | Default | Description |
|---|---|---|
| v_input_1 | 14 | Length |
| v_input_2 | 12 | fastLength |
| v_input_3 | 26 | slowLength |
| v_input_4 | 9 | signalLength |
| v_input_5 | 6 | monthfrom |
| v_input_6 | 12 | monthuntil |
| v_input_7 | true | dayfrom |
| v_input_8 | 31 | dayuntil |
Source (PineScript)
/*backtest
start: 2022-12-18 00:00:00
end: 2023-12-24 00:00:00
period: 1d
basePeriod: 1h
exchanges: [{"eid":"Futures_Binance","currency":"BTC_USDT"}]
*/

//@version=3

strategy(title = "MACD of RSI", overlay = false)
//////////////////////// RSI ///////////////////////////

src = close, len = input(14, minval=1, title="Length")

up = sma(max(change(src), 0), len)

down = sma(-min(change(src), 0), len)

rsi = down == 0 ? 100 : up == 0 ? 0 : 100 - (100 / (1 + up / down))

//////////////////////// RSI   //////////////////////////

//////////////// MACD  ////////////////////////////

sourcemacd = rsi

fastLength = input(12, minval=1), slowLength=input(26,minval=1)

signalLength=input(9,minval=1)


fastMA = ema(sourcemacd, fastLength)

slowMA = ema(sourcemacd, slowLength)

macd = fastMA - slowMA

signal = ema(macd, signalLength)

delta=macd-signal

swap1 = delta>0?green:red


plot(delta,color=swap1,style=columns,title='Histo',histbase=0,transp=20)

p1 = plot(macd,color=blue,title='MACD Line')

p2 = plot(signal,color=red,title='Signal')

fill(p1, p2, color=blue)

hline(0)

/////////////////////////MACD  //////////////////////////

// Conditions

longCond = na

sellCond = na

longCond :=  crossover(delta,0)

sellCond :=  crossunder(delta,0)

monthfrom =input(6)

monthuntil =input(12)

dayfrom=input(1)

dayuntil=input(31)

if (  longCond   )

    strategy.entry("BUY", strategy.long, stop=close, oca_name="TREND", comment="BUY")

else

    strategy.cancel(id="BUY")

if ( sellCond   )

    strategy.close("BUY")
Detail
https://www.fmz.com/strategy/436487
Last Modified
2023-12-25 11:45:10
