Name
MCL-YG波动率突破交易策略MCL-YG-Bollinger-Band-Breakout-Pair-Trading-Strategy
Author
ChaoZhang
Strategy Description
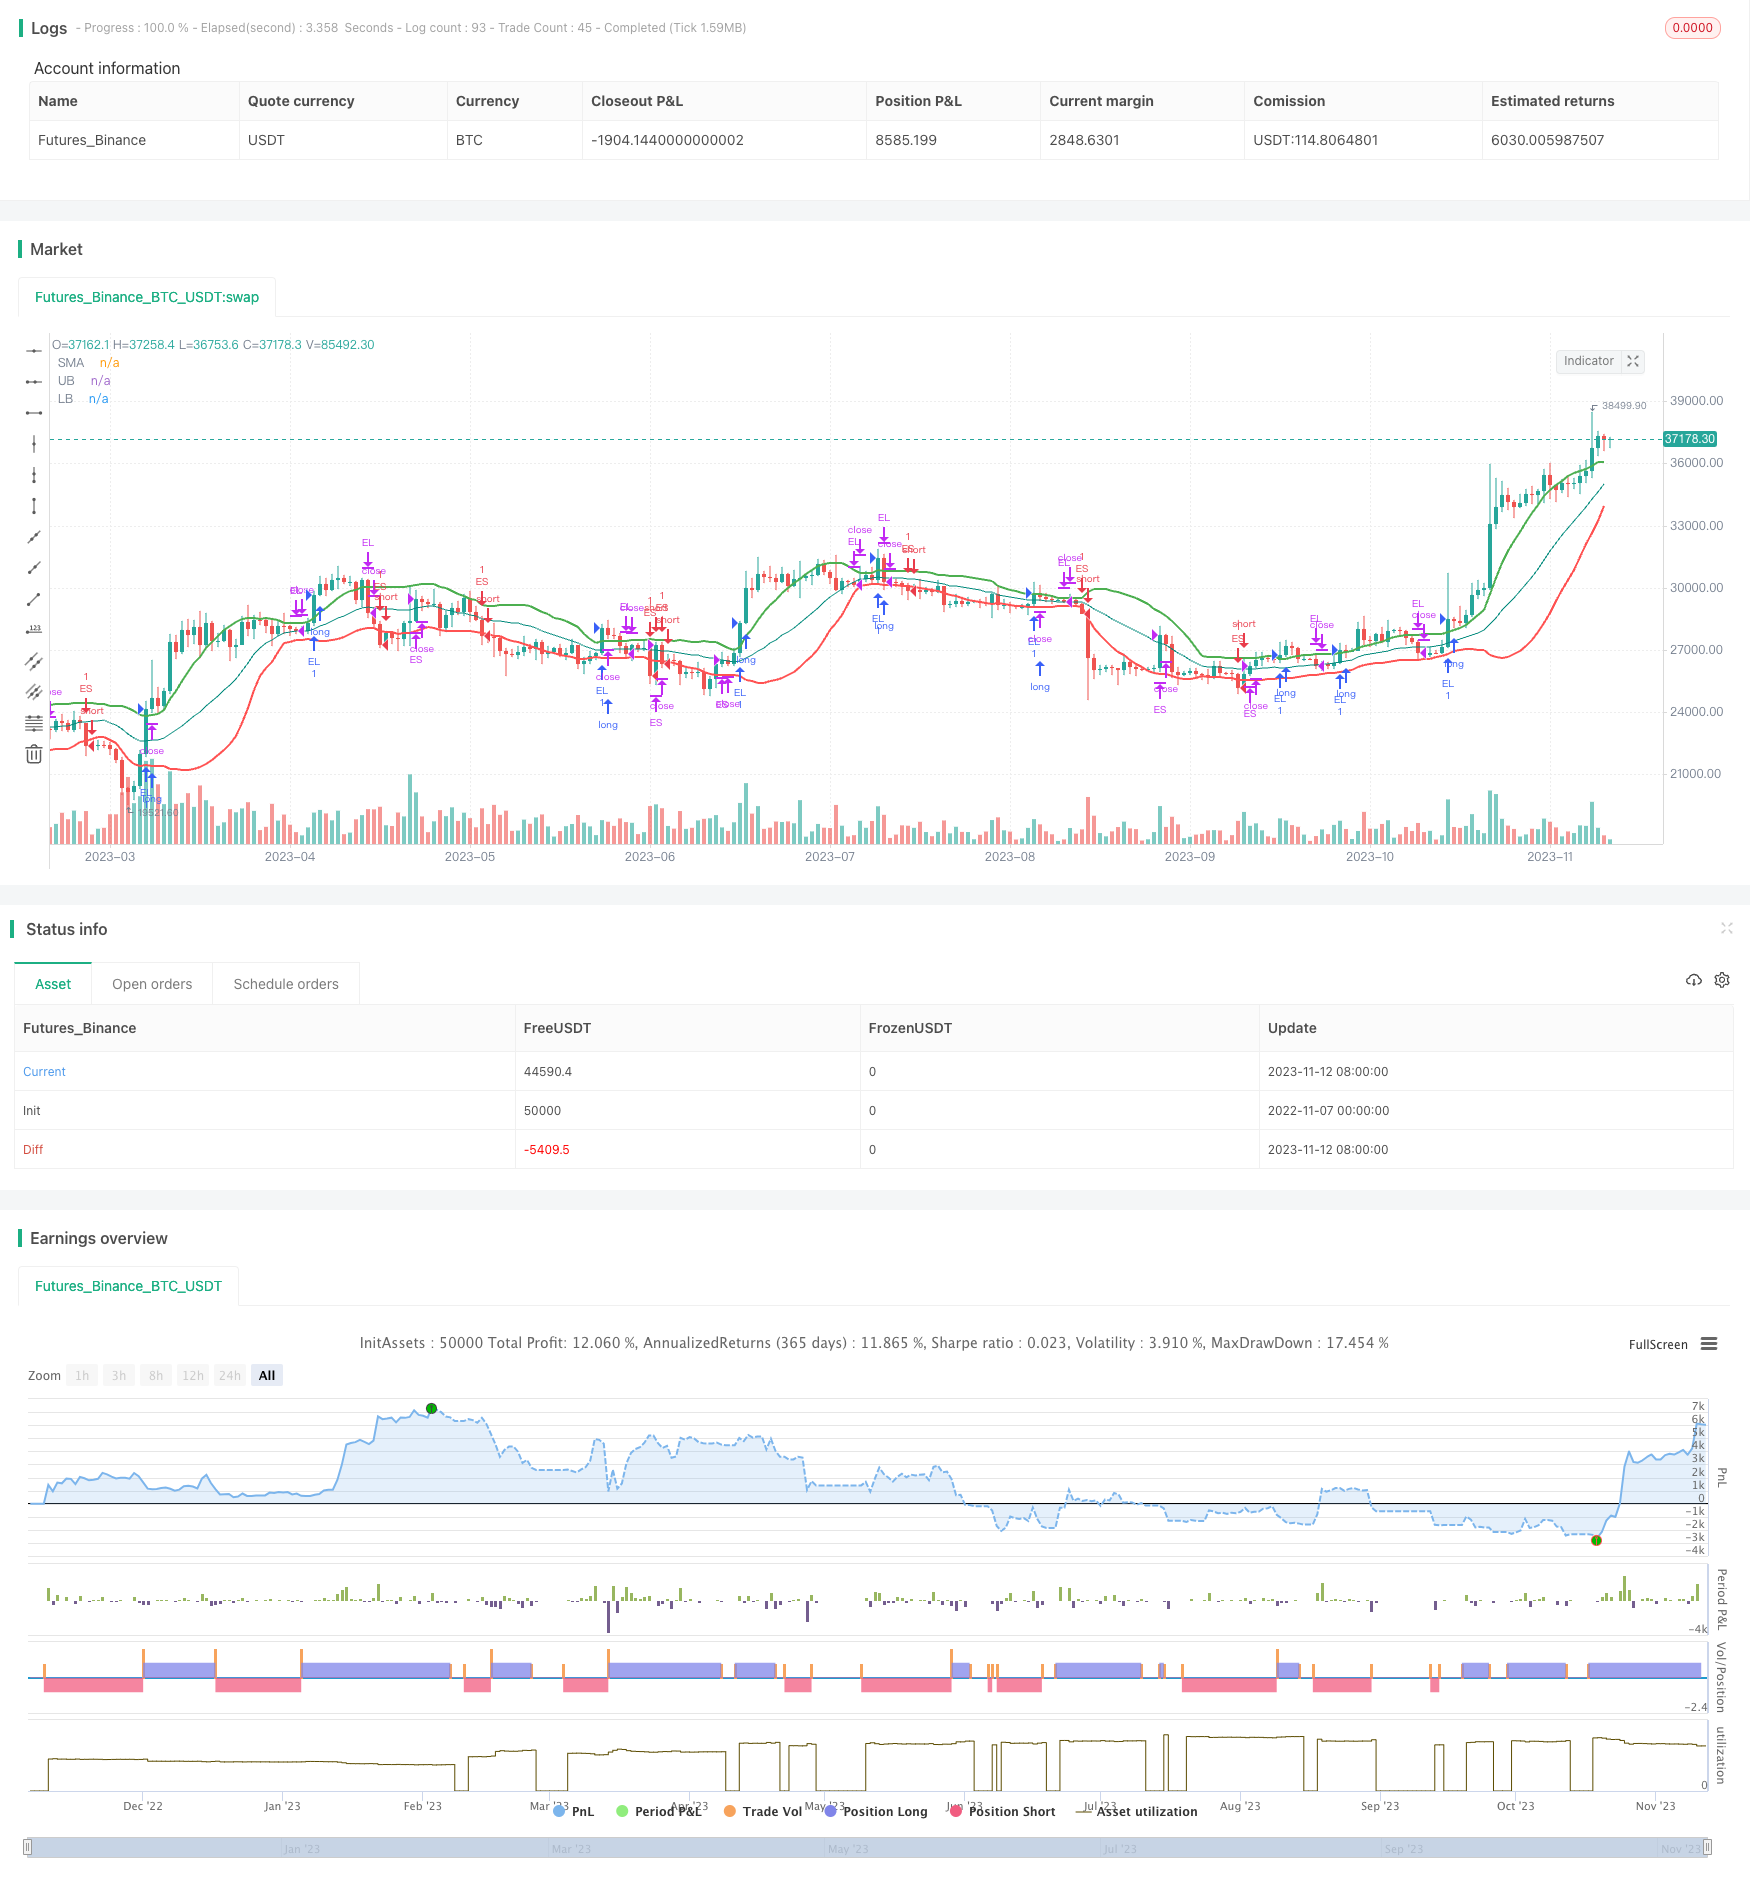
该策略采用布林带突破来检测交易信号,实现了对MCL和YG两个正相关资产的配对交易。当MCL价格触碰布林带上轨时,做多MCL和做空YG;当MCL价格触碰布林带下轨时,做空MCL和做多YG,实现对价格趋势的顺势交易。
首先,该策略基于一定周期内的收盘价计算出SMA均线和标准差StdDev。然后在SMA均线上下各添加一个偏移量,形成布林带的上轨和下轨。当价格触碰上轨时产生买入信号,触碰下轨时产生卖出信号。
该策略采用了布林带的突破交易思路,即价格突破上轨时看多,突破下轨时看空。布林带通过动态调整通道宽度来适应市场变化,能够有效过滤震荡市场的噪音。与固定通道不同,布林带的通道宽度会随着市场波动性的变化而扩大或缩小。在波动性较大时,布林带上下轨间隙较大,可以过滤掉部分噪音。而在波动性较小时,布林带上下轨间隙较小,可以捕捉较小的突破信号。
对两个正相关资产MCL和YG进行配对交易。当MCL突破上轨时,表明MCL价格处于上升趋势,此时做多MCL,同时做空YG,即买入较强的资产,卖出较弱的资产,以获利于两个资产价格差异的扩大。
- 基于布林带的突破交易,能有效过滤市场噪音,识别趋势
- 采用相关资产配对,可以获得正相关资产价格差异的alpha收益
- 动态调整头寸规模,有效控制个别交易的风险
- 采用标准的突破入场和回归中轴出场逻辑,策略逻辑简单清晰
- 布林带参数设置不当可能导致交易频率过高或信号不明显
- 相关资产之间相关性降低会导致配对交易 alpha 收益的下降
- 突破交易容易被波动市场的假突破欺骗,从而产生损失
- 无止损导致单笔损失可能扩大
可以通过优化参数,选择相关性更强、流动性较好的交易对象,设定合理的止损位置等方法来降低风险。
- 优化布林带参数,寻找最佳参数组合
- 测试更多相关资产作为交易对象,选择相关性更强的组合
- 增加止损逻辑,限制单笔损失
- 增加更多过滤条件,避免被假突破欺骗
- 结合其他指标如交易量的确认,改进入场Timing
该策略整体来看较为简单直接,通过布林带捕捉趋势,配对交易获得alpha收益。但存在一些参数优化、止损以及配对选择等可优化空间。通过测试不同参数、交易对象,并适当引入趋势过滤等方法,可以获得更好的策略效果。
||
This strategy uses Bollinger Band breakouts to generate trading signals and implement pair trading between two positively correlated assets MCL and YG. It goes long MCL and short YG when MCL price touches the upper band, and goes short MCL and long YG when MCL price touches the lower band, to trade along the price trend.
Firstly, the strategy calculates the SMA line and StdDev based on closing prices over a certain period. Then it adds an offset above and below the SMA to form the upper and lower bands of the Bollinger Bands. A buy signal is generated when price touches the upper band, and a sell signal when price touches the lower band.
The strategy utilizes the breakout trading logic of Bollinger Bands - go long when price breaks above the upper band and go short when price breaks below the lower band. Bollinger Bands dynamically adjust the width of the bands based on market volatility, which helps filter out market noise during ranging periods. Unlike fixed channel bands, Bollinger Bands widen during high volatility and narrow during low volatility. This allows it to filter some noise when volatility is high, and capture smaller breakouts when volatility is low.
It implements pair trading between two positively correlated assets MCL and YG. When MCL breaks above the upper band, it shows MCL is in an uptrend. The strategy goes long MCL and short YG - buying the stronger asset and selling the weaker one, to benefit from the divergence in their prices.
- Breakout trading based on Bollinger Bands can effectively filter market noise and identify trends
- Pair trading on correlated assets can gain alpha returns from price divergence
- Dynamic position sizing helps control risk for individual trades
- Standard breakout entry and reversion exit logic makes the strategy logic simple and clear
- Poor Bollinger Bands parameter tuning may lead to too many signals or unclear signals
- Declining correlation between the assets can reduce profits from the pair trading
- Breakouts may be fooled by false signals in choppy markets, causing losses
- No stop loss may lead to enlarged losses for single trades
Risks can be reduced by optimizing parameters, selecting assets with stronger correlation and liquidity, setting proper stop loss etc.
- Optimize Bollinger Bands parameters to find best combination
- Test more correlated asset pairs and select the best combination
- Add stop loss logic to limit losses for single trades
- Add more filters to avoid false breakout signals
- Incorporate other factors like volume confirmation to improve entry timing
Overall the strategy is simple and straightforward, capturing trends with Bollinger Bands and gaining alpha from pair trading. But there is room for improvement in parameters tuning, stop loss, and pair selection. Further testing of parameters, trading vehicles, trend filters etc. can improve the strategy performance.
[/trans]
Strategy Arguments
| Argument | Default | Description |
|---|---|---|
| v_input_int_1 | 20 | SMA Length |
| v_input_int_2 | 20 | StdDev Length |
| v_input_float_1 | true | Upper Band Offset |
| v_input_float_2 | true | Lower Band Offset |
| v_input_bool_1 | true | Use Position Sizing? |
| v_input_float_3 | 0.5 | Risk % |
Source (PineScript)
/*backtest
start: 2022-11-07 00:00:00
end: 2023-11-13 00:00:00
period: 1d
basePeriod: 1h
exchanges: [{"eid":"Futures_Binance","currency":"BTC_USDT"}]
*/

// This source code is subject to the terms of the Mozilla Public License 2.0 at https://mozilla.org/MPL/2.0/
// © shark792

//@version=5

// 1. Define strategy settings
strategy(title="MCL-YG Pair Trading Strategy", overlay=true,
     pyramiding=0, initial_capital=10000,
     commission_type=strategy.commission.cash_per_order,
     commission_value=4, slippage=2)

smaLength = input.int(title="SMA Length", defval=20)
stdLength = input.int(title="StdDev Length", defval=20)

ubOffset = input.float(title="Upper Band Offset", defval=1, step=0.5)
lbOffset = input.float(title="Lower Band Offset", defval=1, step=0.5)

usePosSize = input.bool(title="Use Position Sizing?", defval=true)
riskPerc   = input.float(title="Risk %", defval=0.5, step=0.25)


// 2. Calculate strategy values
smaValue = ta.sma(close, smaLength)
stdDev   = ta.stdev(close, stdLength)

upperBand = smaValue + (stdDev * ubOffset)
lowerBand = smaValue - (stdDev * lbOffset)

riskEquity  = (riskPerc / 100) * strategy.equity
atrCurrency = (ta.atr(20) * syminfo.pointvalue)
posSize     = usePosSize ? math.floor(riskEquity / atrCurrency) : 1


// 3. Output strategy data
plot(series=smaValue, title="SMA", color=color.teal)

plot(series=upperBand, title="UB", color=color.green,
     linewidth=2)
plot(series=lowerBand, title="LB", color=color.red,
     linewidth=2)


// 4. Determine long trading conditions
enterLong = ta.crossover(close, upperBand)
exitLong  = ta.crossunder(close, smaValue)


// 5. Code short trading conditions
enterShort = ta.crossunder(close, lowerBand)
exitShort  = ta.crossover(close, smaValue)


// 6. Submit entry orders
if enterLong
    strategy.entry(id="EL", direction=strategy.long, qty=posSize)

if enterShort
    strategy.entry(id="ES", direction=strategy.short, qty=posSize)


// 7. Submit exit orders
strategy.close(id="EL", when=exitLong)
strategy.close(id="ES", when=exitShort)
Detail
https://www.fmz.com/strategy/432093
Last Modified
2023-11-14 13:49:12
