Name
P-信号反转策略P-Signal-Reversal-Strategy
Author
ChaoZhang
Strategy Description
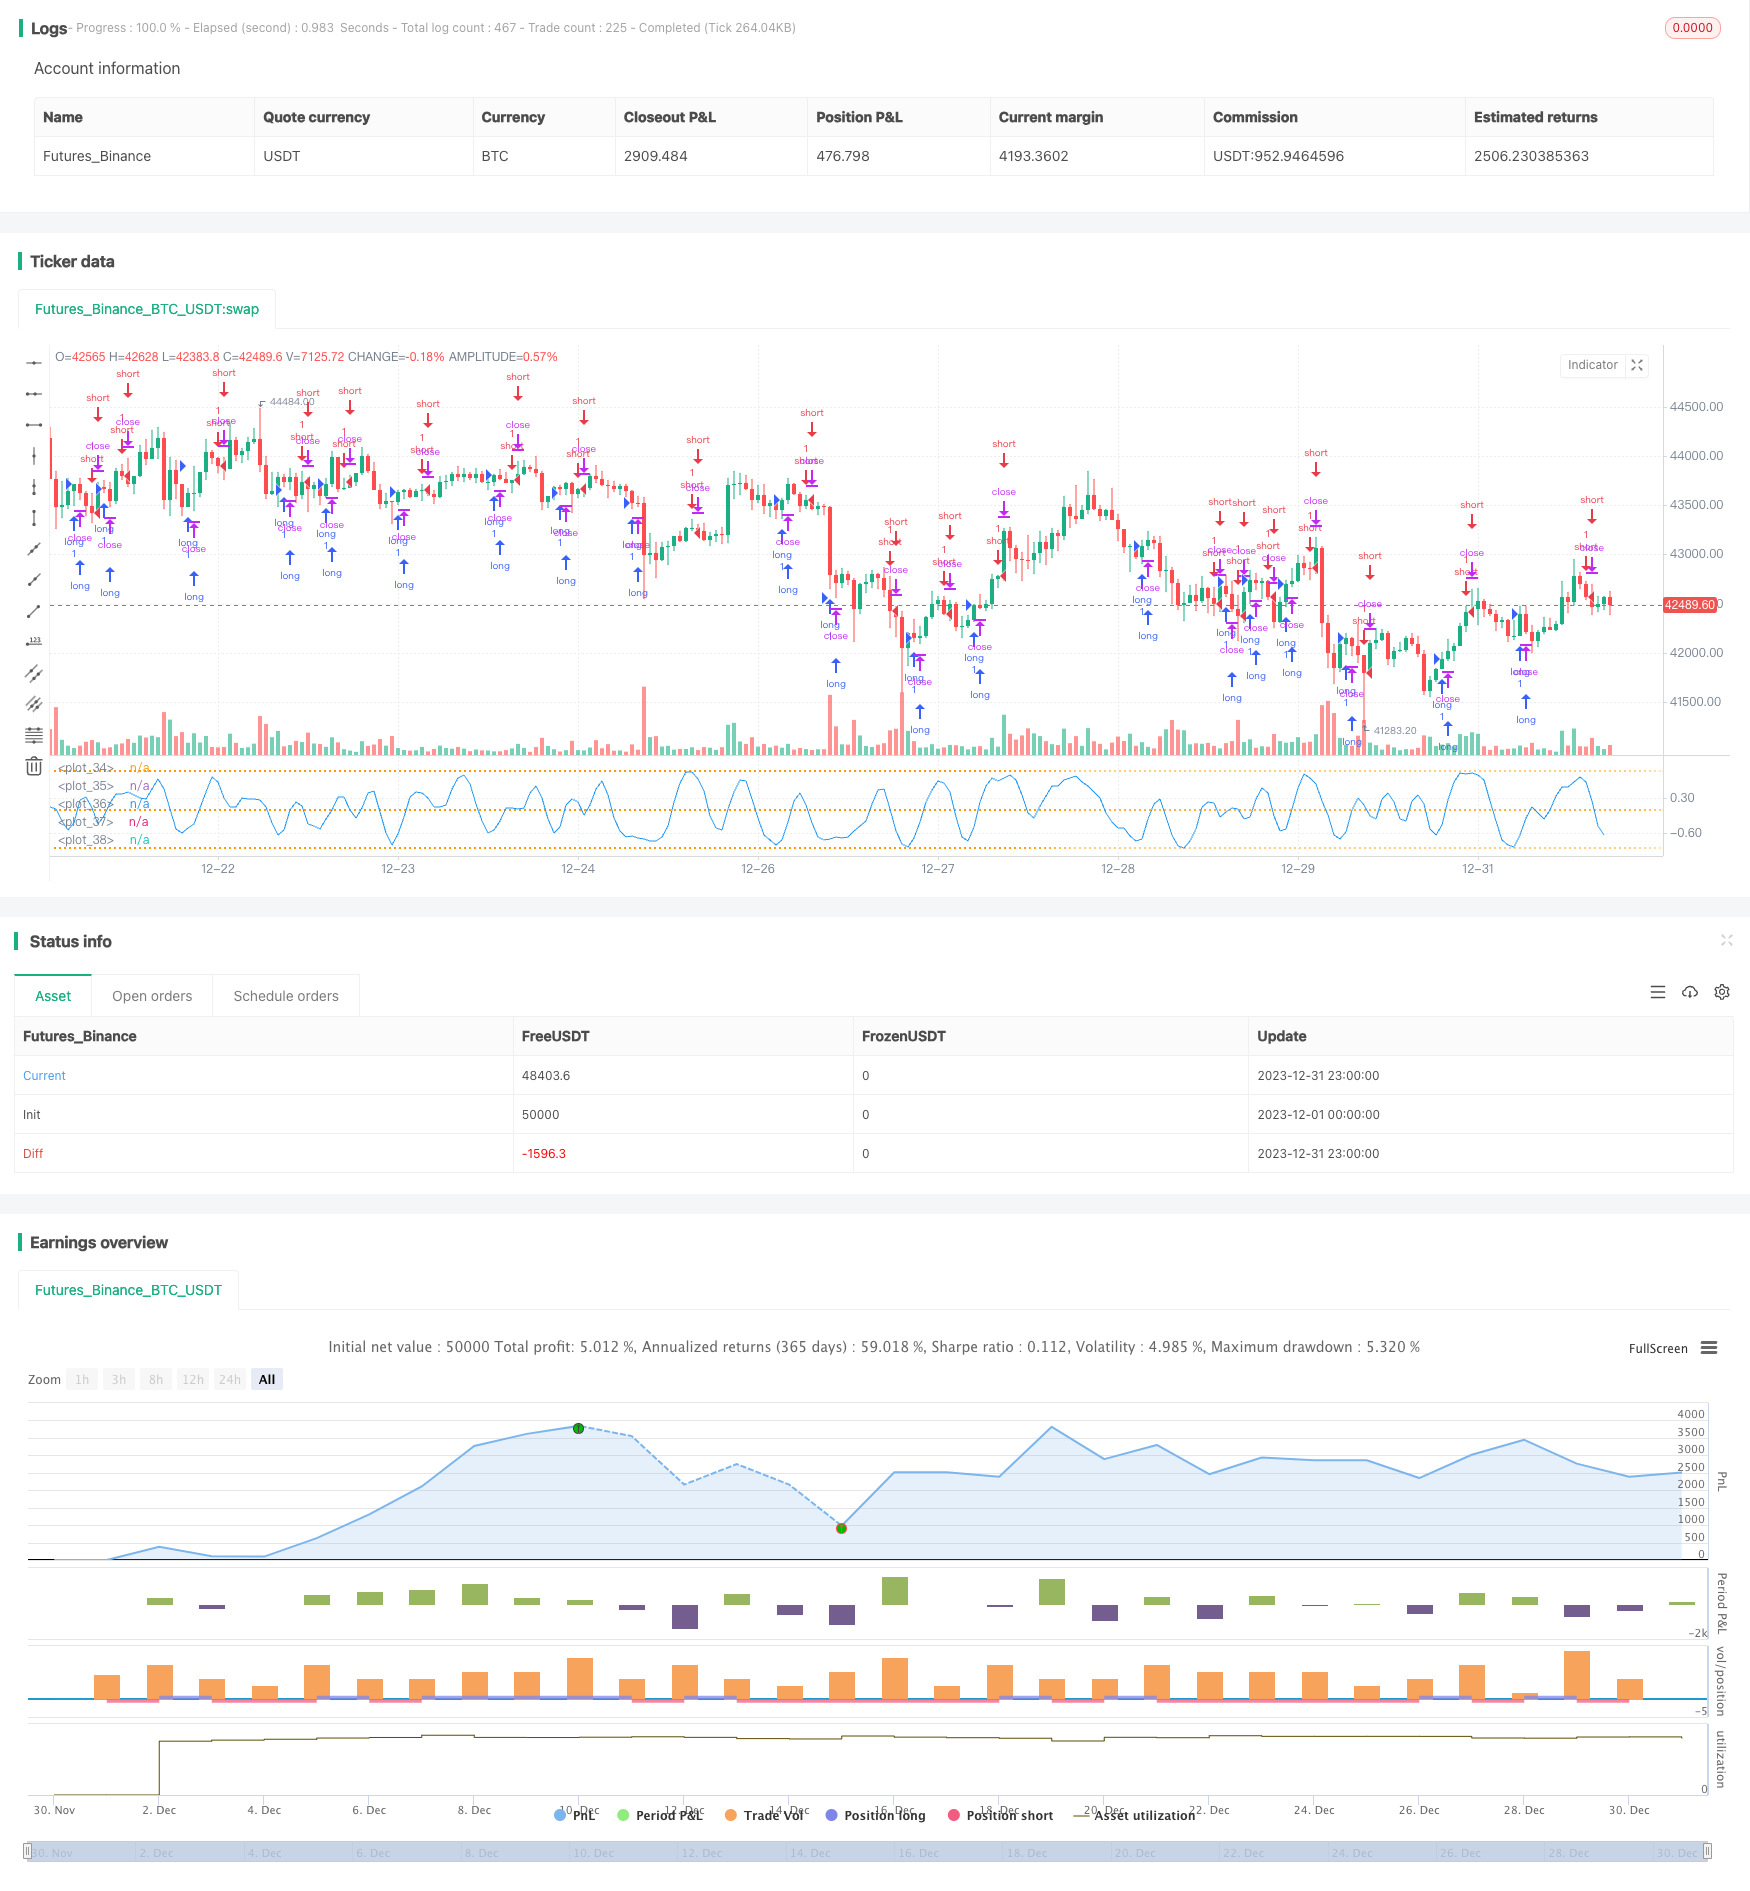
P-信号反转策略是一种基于统计参数和误差函数构建的概率空间信号的量化交易策略。它通过追踪一系列K线的极值分布的参数,动态获取交易信号,以捕获市场反转点。
该策略的核心指标是P-信号,它结合了移动平均和标准差的统计参数,通过高斯误差函数映射到-1到1之间,形成量化判断指标。当P-信号从正向负反转时做空,从负向正反转时做多,形成反转策略逻辑。
策略参数包括 Cardinality、ΔErf 和观察时间。Cardinality 控制样本数量,ΔErf 控制误差函数的死区,降低交易频率。观察时间控制策略起始时间。
P-信号反转策略最大的优势在于,它建立在统计参数的概率分布之上,能有效判断市场的特征点,捕捉反转机会。相比单一技术指标,它结合更多市场信息, judgement更为全面和可靠。
另外,该策略参数化设计规范,用户可根据自身需要,调节参数空间寻找最佳组合。这保证了策略的适应性과灵活性。
P-信号反转策略的主要风险在于,它过于依赖概率分布的参数,容易受异常数据的影响产生误判。此外,反转策略的盈亏比例普遍偏低,单笔盈利有限。
可以通过提高 Cardinality参数加大样本量来减少数据异常的影响。适当放大ΔErf范围,降低交易频率,以控制风险。
P-信号反转策略可从以下几个方面进行优化:
-
结合其他指标过滤异常信号,例如交易量突增等特征。
-
在多时间框架验证信号,加强判断的稳定性。
-
增加止损策略,降低单笔损失。
-
优化参数寻找最佳组合,提高盈利率。
-
结合机器学习判断参数动态调整。
P-信号反转策略立足概率分布构建量化交易框架,参数设计灵活,用户友好。它有效判断市场 statistical特征,捕捉反转机会。该策略可通过多指标验证、止损优化等手段进一步增强稳定性和profitability。它为利用量化手段进行algorithmic trading提供了一种高效可靠的范例。
||
The P-Signal reversal strategy is a quantitative trading strategy built based on statistical parameters and error functions to construct a probabilistic signal space. It dynamically acquires trading signals by tracking the extreme value distributions of a series of K-lines to capture market reversal points.
The core indicator of this strategy is the P-signal, which combines the statistical parameters of moving averages and standard deviations and maps them to the range of -1 to 1 through the Gaussian error function to form a quantified judgment indicator. It goes short when the P-signal reverses from positive to negative, and goes long when it reverses from negative to positive, forming a reversal strategy logic.
Strategy parameters include Cardinality, ΔErf and Observation Time. Cardinality controls the sample size, ΔErf controls the dead band of the error function to reduce trading frequency. Observation time controls the start time of the strategy.
The biggest advantage of the P-signal reversal strategy is that it is built on the probability distributions of statistical parameters, which can effectively judge the characteristic points of the market and capture reversal opportunities. Compared with a single technical indicator, it incorporates more market information and makes more comprehensive and reliable judgements.
In addition, the parameterized design of the strategy is well regulated, allowing users to adjust the parameter space according to their own needs to find the optimal combination. This ensures the adaptability and flexibility of the strategy.
The main risk of the P-signal reversal strategy is that it relies too much on the parameters of the probability distribution, which is easily affected by abnormal data resulting in misjudgements. In addition, the risk-reward ratio of reversal strategies is generally low, with limited single profit.
Increasing the Cardinality parameter to increase the sample size can reduce the impact of data anomalies. Appropriately expanding the ΔErf range to reduce trading frequency helps control risks.
The P-signal reversal strategy can be optimized in the following aspects:
-
Incorporate other indicators to filter out abnormal signals, such as sharp increases in volume.
-
Validate signals across multiple timeframes to enhance judgment stability.
-
Increase stop loss strategies to reduce single losses.
-
Optimize parameters to find the best combination and improve profitability.
-
Incorporate machine learning for dynamic parameter adjustment.
The P-signal reversal strategy establishes a quantitative trading framework based on probability distributions with flexible parameter designs and user friendliness. It effectively judges the statistical characteristics of markets and captures reversal opportunities. The strategy can be further enhanced in stability and profitability through multi-indicator validation, stop loss optimization and other means. It provides an efficient and reliable paradigm for algorithmic trading using quantitative techniques.
[/trans]
Strategy Arguments
| Argument | Default | Description |
|---|---|---|
| v_input_int_1 | 4 | (?Parameters of strategy.)Cardinality: |
| v_input_float_1 | false | |
| v_input_1 | timestamp(30 Dec 1957 00:00 +0300) | (?Observation time.)Start date: |
Source (PineScript)
/*backtest
start: 2023-12-01 00:00:00
end: 2023-12-31 23:59:59
period: 1h
basePeriod: 15m
exchanges: [{"eid":"Futures_Binance","currency":"BTC_USDT"}]
*/

//@version=5
// **********************************************************************************************************
// This source code is subject to the terms of the Mozilla Public License 2.0 at https://mozilla.org/MPL/2.0/
// P-Signal Strategy RVS © Kharevsky
// **********************************************************************************************************
strategy('P-Signal Strategy RVS.', precision=3, process_orders_on_close=true, pyramiding=0,
     commission_type=strategy.commission.percent,
     commission_value=0.2)
// Parameters and const of P-Signal.
nPoints = input.int(title='Cardinality:', defval=4, minval=4, maxval=200, group='Parameters of strategy.')
ndErf = input.float(title='|ΔErf|:', defval=0, minval=0, maxval=1, step=0.01, group='Parameters of strategy.')
tStartDate = input(title='Start date:', defval=timestamp('30 Dec 1957 00:00 +0300'), group='Observation time.')
int nIntr = nPoints - 1
// Horner's method for the error (Gauss) & P-Signal functions.
fErf(x) =>
    nT = 1.0 / (1.0 + 0.5 * math.abs(x))
    nAns = 1.0 - nT * math.exp(-x * x - 1.26551223 +
     nT * (1.00002368 + nT * (0.37409196 + nT * (0.09678418 +
     nT * (-0.18628806 + nT * (0.27886807 + nT * (-1.13520398 +
     nT * (1.48851587 + nT * (-0.82215223 + nT * 0.17087277)))))))))
    x >= 0 ? nAns : -nAns
fPSignal(ser, int) =>
    nStDev = ta.stdev(ser, int)
    nSma = ta.sma(ser, int)
    nStDev > 0 ? fErf(nSma / nStDev / math.sqrt(2)) : math.sign(nSma)
// Data.
float nPSignal = ta.sma(fPSignal(ta.change(ohlc4), nIntr), nIntr)
float ndPSignal = math.sign(nPSignal[0] - nPSignal[1])
bool isStartDate = true
// Reversal Strategy.
strategy.entry('short', strategy.short, when=isStartDate and nPSignal > ndErf and ndPSignal < 0)
strategy.entry('long', strategy.long, when=isStartDate and nPSignal < -ndErf and ndPSignal > 0)
// Plotting.
hline(+1.0, color=color.new(color.orange, 70), linestyle=hline.style_dotted, editable=false)
hline(-1.0, color=color.new(color.orange, 70), linestyle=hline.style_dotted, editable=false)
hline(-ndErf, color=color.new(color.orange, 70), linestyle=hline.style_dotted, editable=false)
hline(ndErf, color=color.new(color.orange, 70), linestyle=hline.style_dotted, editable=false)
plot(nPSignal, color=color.new(color.blue, 0), style=plot.style_line)
// Table of state.
if barstate.isconfirmed
    var Table = table.new(position=position.bottom_right, columns=3, rows=1,
     frame_color=color.new(color.orange, 70), frame_width=1,
     border_color=color.new(color.orange, 70), border_width=1)
    table.cell(table_id=Table, column=0, row=0,
     text=strategy.position_size > 0 ? 'Long: ' + str.tostring(strategy.position_size) : 'Short: ' + str.tostring(strategy.position_size),
     text_color=strategy.position_size > 0 ? color.green : color.red)
    table.cell(table_id=Table, column=1, row=0,
     text='Net P/L: ' + str.tostring(strategy.netprofit, '#.#'),
     text_color=strategy.netprofit > 0 ? color.green : color.red)
    table.cell(table_id=Table, column=2, row=0,
     text='Open P/L: ' + str.tostring(strategy.openprofit, '#.#'),
     text_color=strategy.openprofit > 0 ? color.green : color.red)
// The end.
Detail
https://www.fmz.com/strategy/440338
Last Modified
2024-01-29 14:44:56
