Name
RSI与MA均线交叉的趋势追踪策略RSI-and-MA-Crossover-Trend-Tracking-Strategy
Author
ChaoZhang
Strategy Description
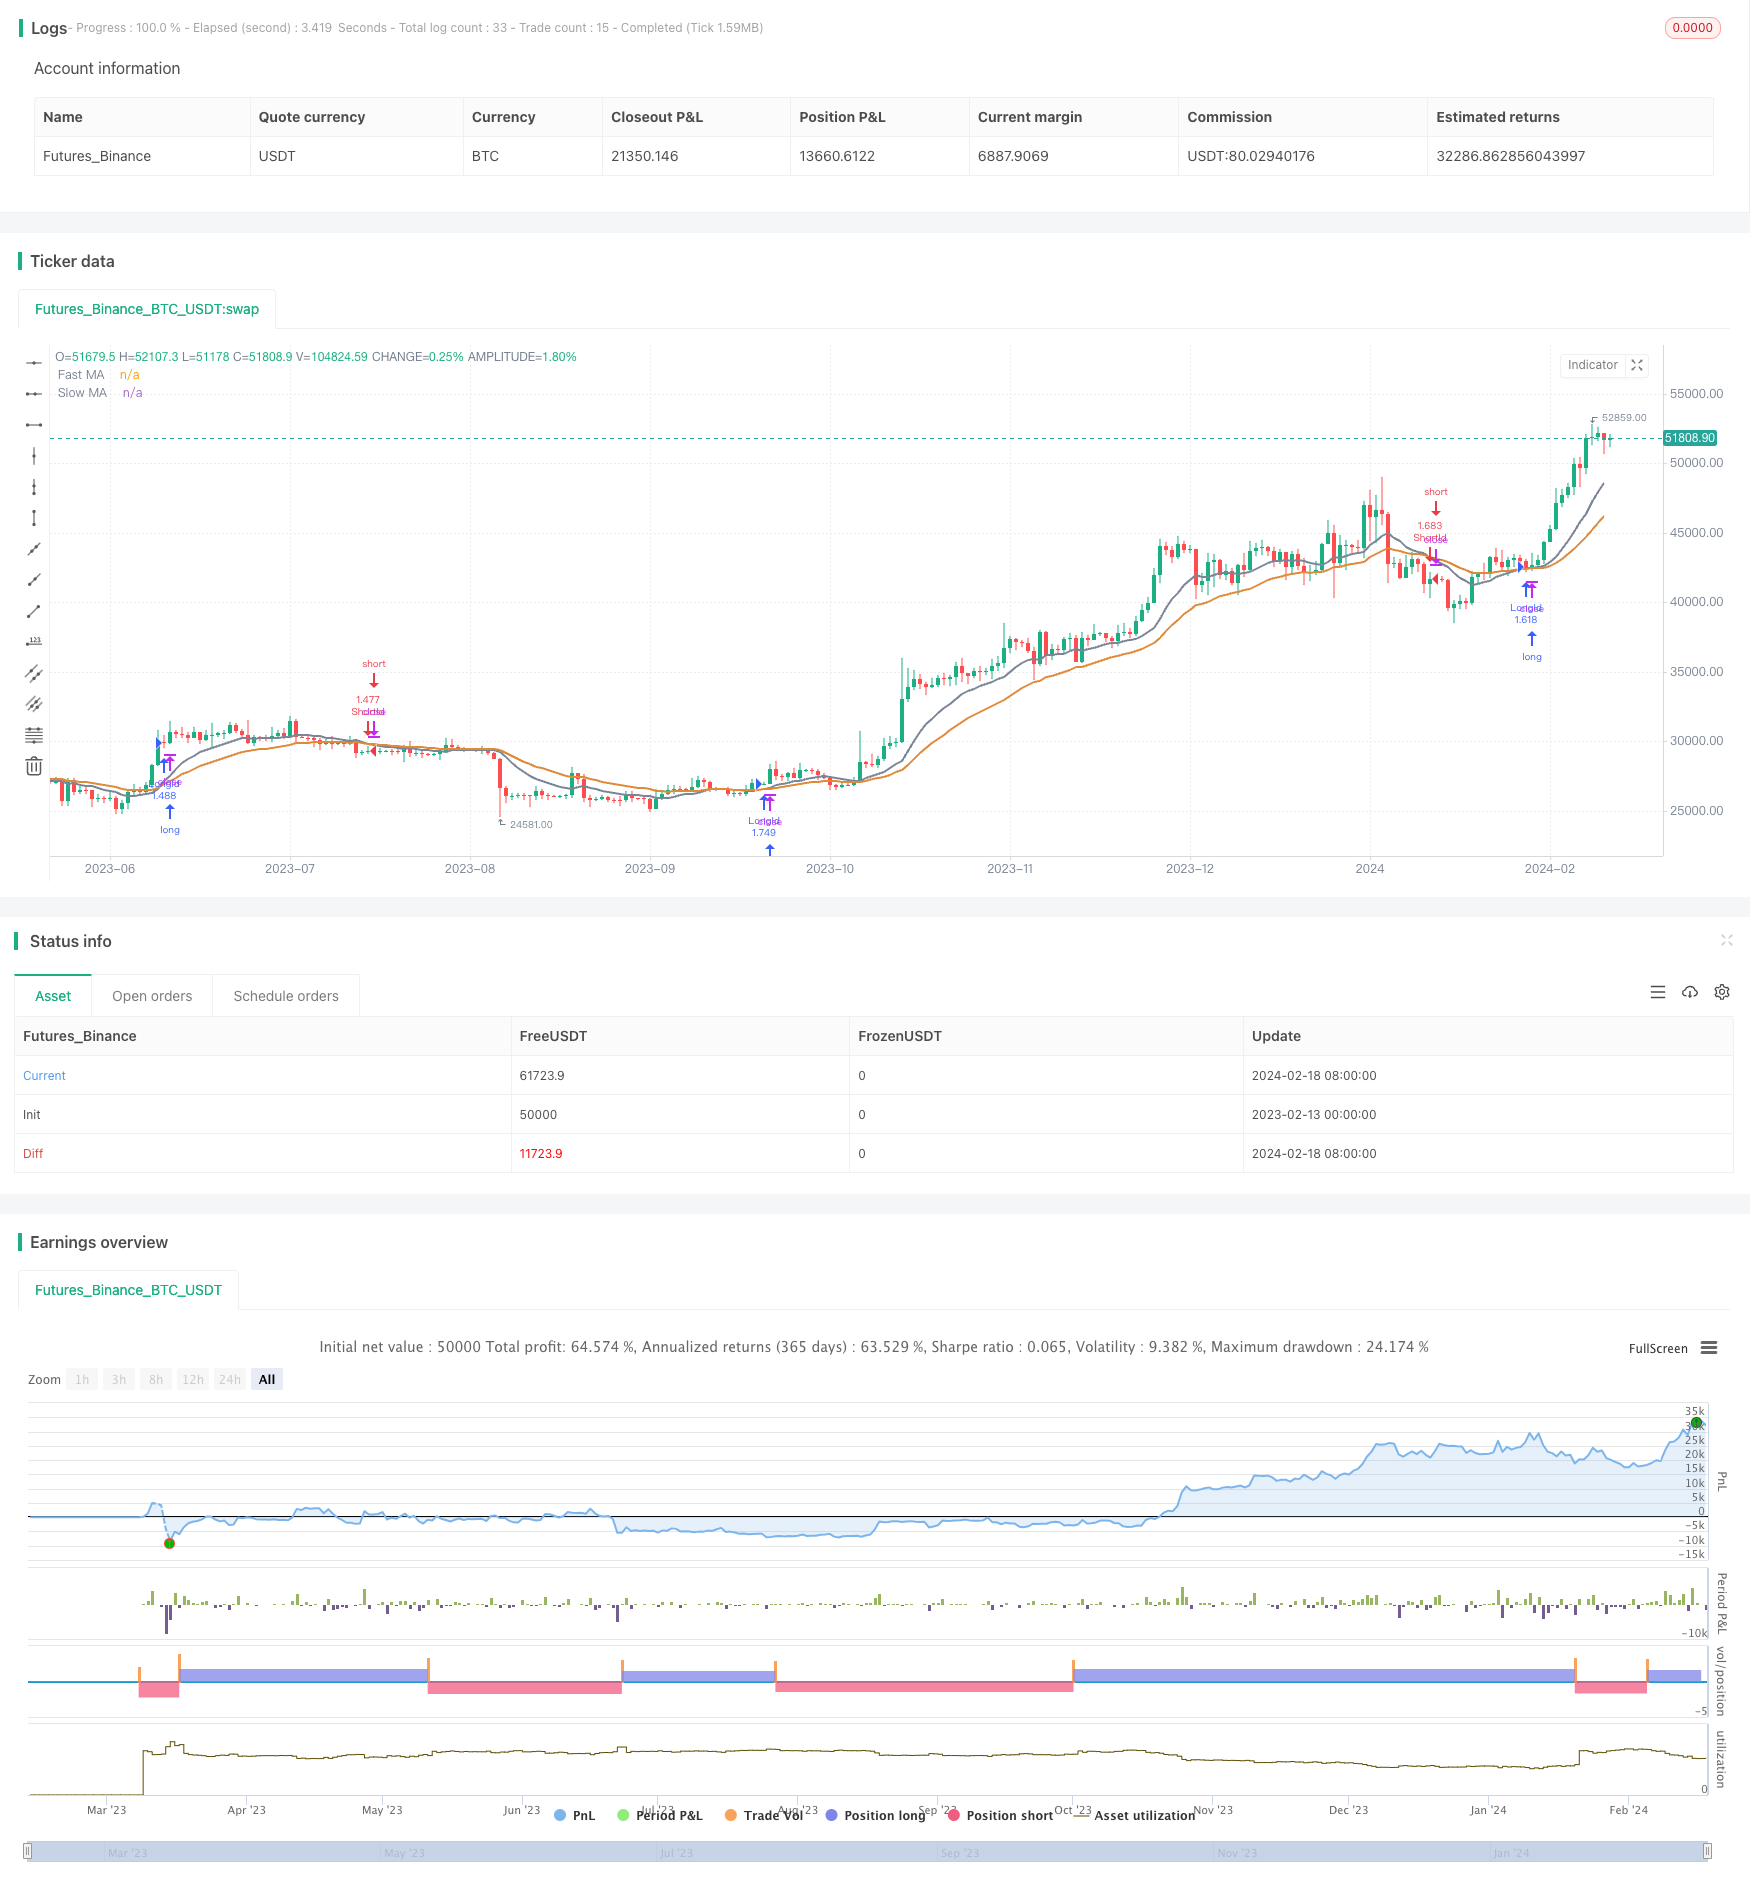
该策略通过RSI指标与两条不同周期的MA均线的交叉来判断行情趋势和 entrada 入场时机。策略只在RSI高于其自身26周期均线时做多,RSI低于其自身26周期均线时做空,以控制风险。
该策略使用12周期和26周期两条MA均线。当12周期快线上穿26周期慢线时,认为行情进入上升趋势;当快线下穿慢线时,认为行情进入下降趋势。策略在均线发生黄金交叉时做多,死亡交叉时做空。
同时,策略引入RSI指标判断超买超卖区域。只有当RSI高于其自身26周期均线时,才会在均线发生黄金交叉时开仓做多;只有当RSI低于其自身26周期均线时,才会在均线发生死亡交叉时开仓做空。这可以避免在行情被超买或超卖的情况下强行开仓,从而控制风险。
该策略结合均线和RSI指标判断趋势和入场时机,可以有效跟踪趋势。引入RSI指标作为过滤条件,可以减少开仓次数,避免在震荡行情中被套。不设置止损,可以充分跟踪趋势达到更高收益。
由于不设止损,如果判断错误,亏损可能会放大。如果行情出现大幅跳空,也可能造成较大亏损。此外,RSI过滤条件如果设定不当,也可能错过较好的入场时机。
可以考虑设置止损来控制最大亏损。可以适当调整RSI的参数,寻找更好的过滤条件。如果行情波动较大,可以适当调整均线的参数,使用更慢的均线来判断趋势。
该策略可以从以下几个方面进行优化:
-
测试不同周期的MA均线组合,寻找更匹配当下行情特点的均线参数。
-
测试RSI的不同周期参数、不同的过滤条件,优化入场时机。
-
加入其他指标或过滤条件,提高系统稳定性。例如加入量能指标、交易量指标等与趋势判断相关的指标。
-
优化止损策略,在跟踪趋势的同时控制风险。可以测试追踪止损、百分比止损、动态止损等止损策略。
该策略总体较为简单直接,通过均线交叉判断趋势,RSI避免强行开仓,从而跟踪趋势达到较好收益。可以通过参数优化、增加其他指标等方式进一步完善该策略,使其更适合复杂多变的市场环境。
||
This strategy determines market trends and entry signals by the crossover of the RSI indicator and two moving averages (MAs) of different periods. It only goes long when RSI is above its 26-period MA and goes short when RSI is below to control risks.
The strategy employs two MAs of 12- and 26-period. When the 12-period fast MA crosses above the 26-period slow MA, it signals an upward trend, and vice versa. The strategy goes long on golden crossover and goes short on death crossover of the two MAs.
The RSI indicator is also used to determine overbought/oversold zones. Only when RSI is higher than its 26-period MA will the strategy open long positions on golden crossover. And only when RSI is lower will it open short positions on death crossover. This avoids forced entries against overbought/oversold situations and hence controls risks.
By combining MAs and RSI for trend and timing analysis, this strategy can effectively track trends. The RSI filter reduces trade frequencies and avoids whipsaws in ranging markets. Not using a stop loss allows full trend following for higher returns.
Without a stop loss, losses may amplify on wrong signals. Large gap moves may also lead to heavy losses. Also, improperly set RSI filters may cause missing good entry signals.
Consider using a stop loss to control maximum losses. Fine tune RSI parameters for better filters. For volatile markets, use slower MAs to judge the trend.
The strategy can be improved in the following aspects:
-
Test MA combos of different periods to find parameters best fitting current market conditions.
-
Optimize RSI periods and filter logics for better entry timing.
-
Add other indicators like volume for better system stability.
-
Optimize stop loss strategies to balance trend following and risk control, e.g., trailing stop, percentage stop, dynamic stop etc.
The strategy is relatively simple and straightforward, using MA crossovers to determine trends and RSI to avoid forced entries, thus tracking trends for good returns. Further improvements can be made through parameter tuning and adding other filters to suit complex market environments.
[/trans]
Strategy Arguments
| Argument | Default | Description |
|---|---|---|
| v_input_1 | 2018 | Backtest Start Year |
| v_input_2 | true | Backtest Start Month |
| v_input_3 | true | Backtest Start Day |
| v_input_4 | false | UseStopLoss |
| v_input_5 | 20 | Stop loss percentage(0.1%) |
| v_input_6_open | 0 | Fast MA Source: open |
| v_input_7 | 12 | Fast MA Period |
| v_input_8_open | 0 | Slow MA Source: open |
| v_input_9 | 26 | Slow MA Period |
Source (PineScript)
/*backtest
start: 2023-02-13 00:00:00
end: 2024-02-19 00:00:00
period: 1d
basePeriod: 1h
exchanges: [{"eid":"Futures_Binance","currency":"BTC_USDT"}]
*/

//@version=2

strategy(title = "EMA Cross Strategy", shorttitle = "EMA Cross",calc_on_order_fills=true,calc_on_every_tick =true, initial_capital=21000,commission_value=.25,overlay = true,default_qty_type = strategy.percent_of_equity, default_qty_value = 100)
StartYear = input(2018, "Backtest Start Year")
StartMonth = input(1, "Backtest Start Month")
StartDay = input(1, "Backtest Start Day")
UseStopLoss = input(false,"UseStopLoss")
//rsiLong = true
rsi1 = rsi(close, 14)

window() => true

stopLoss = input(20, title = "Stop loss percentage(0.1%)")
//stopLoss = input(200, title = "Stop loss percentage(0.1%)")

maFastSource   = input(defval = open, title = "Fast MA Source")
maFastLength   = input(defval = 12, title = "Fast MA Period", minval = 1)
// long ma
maSlowSource   = input(defval = open, title = "Slow MA Source")
maSlowLength   = input(defval = 26, title = "Slow MA Period", minval = 1)

maFast = ema(maFastSource, maFastLength)
maSlow = ema(maSlowSource, maSlowLength)

//12 and 26=9%; 3 and8=2%; 26 and 55=2%; when selling on a cross under
//maFastRSI = ema(rsi1, 12)
//maSlowRSI = ema(rsi1, 26)

fast = plot(maFast, title = "Fast MA", color = #7a8598, linewidth = 2, style = line, transp = 50)
slow = plot(maSlow, title = "Slow MA", color = #e08937, linewidth = 2, style = line, transp = 50)


longEMA = crossover(maFast, maSlow)
exitLong = crossunder(maFast, maSlow) // 5% in 2018
//exitLong = crossunder(close, maFast) // 15% in 2018
//exitLong = crossunder(rsi1, maFastRSI) // 13%

shortEMA = crossover(maSlow, maFast)
exitShort = crossover(maFast, maSlow)

//if (rsi1 < ema(rsi1,7))
//rsiLong = false

//if (longEMA and (rsi1 >= highest(rsi1,10)))
//if (longEMA)
if (longEMA and (rsi1 > ema(rsi1,26)))  //RSI ema values optimal from 19 to 35
    strategy.entry("LongId", strategy.long, when=window())

//strategy.close_all(when = rsi1 > 60) // 80=26%, 90=n/a, 70=15%, 60=16% long only
//strategy.close_all(when = (shortEMA and (rsi1 <= ema(rsi1,26)))) //10% gain in 2018 long only
//strategy.close_all(when = (rsi1 <= ema(rsi1,120))) //26=17% 14=2% 42=15%
//strategy.close_all(when = (shortEMA)) // 5% gain in 2018 long only
//strategy.close_all(when = exitLong)

//if (shortEMA and not(rsiLong))
//if (shortEMA)
if (shortEMA and (rsi1 <= ema(rsi1,26)))
    strategy.entry("ShortId", strategy.short, when=window())

if (UseStopLoss)
    strategy.exit("StopLoss", "LongId", loss = close * stopLoss / 1000 / syminfo.mintick)
    strategy.exit("StopLoss", "ShortId", loss = close * stopLoss / 1000 / syminfo.mintick)
Detail
https://www.fmz.com/strategy/442251
Last Modified
2024-02-20 15:31:15
