Name
RSI和随机RSI组合策略RSI-and-Stochastic-RSI-Combination-Strategy
Author
ChaoZhang
Strategy Description
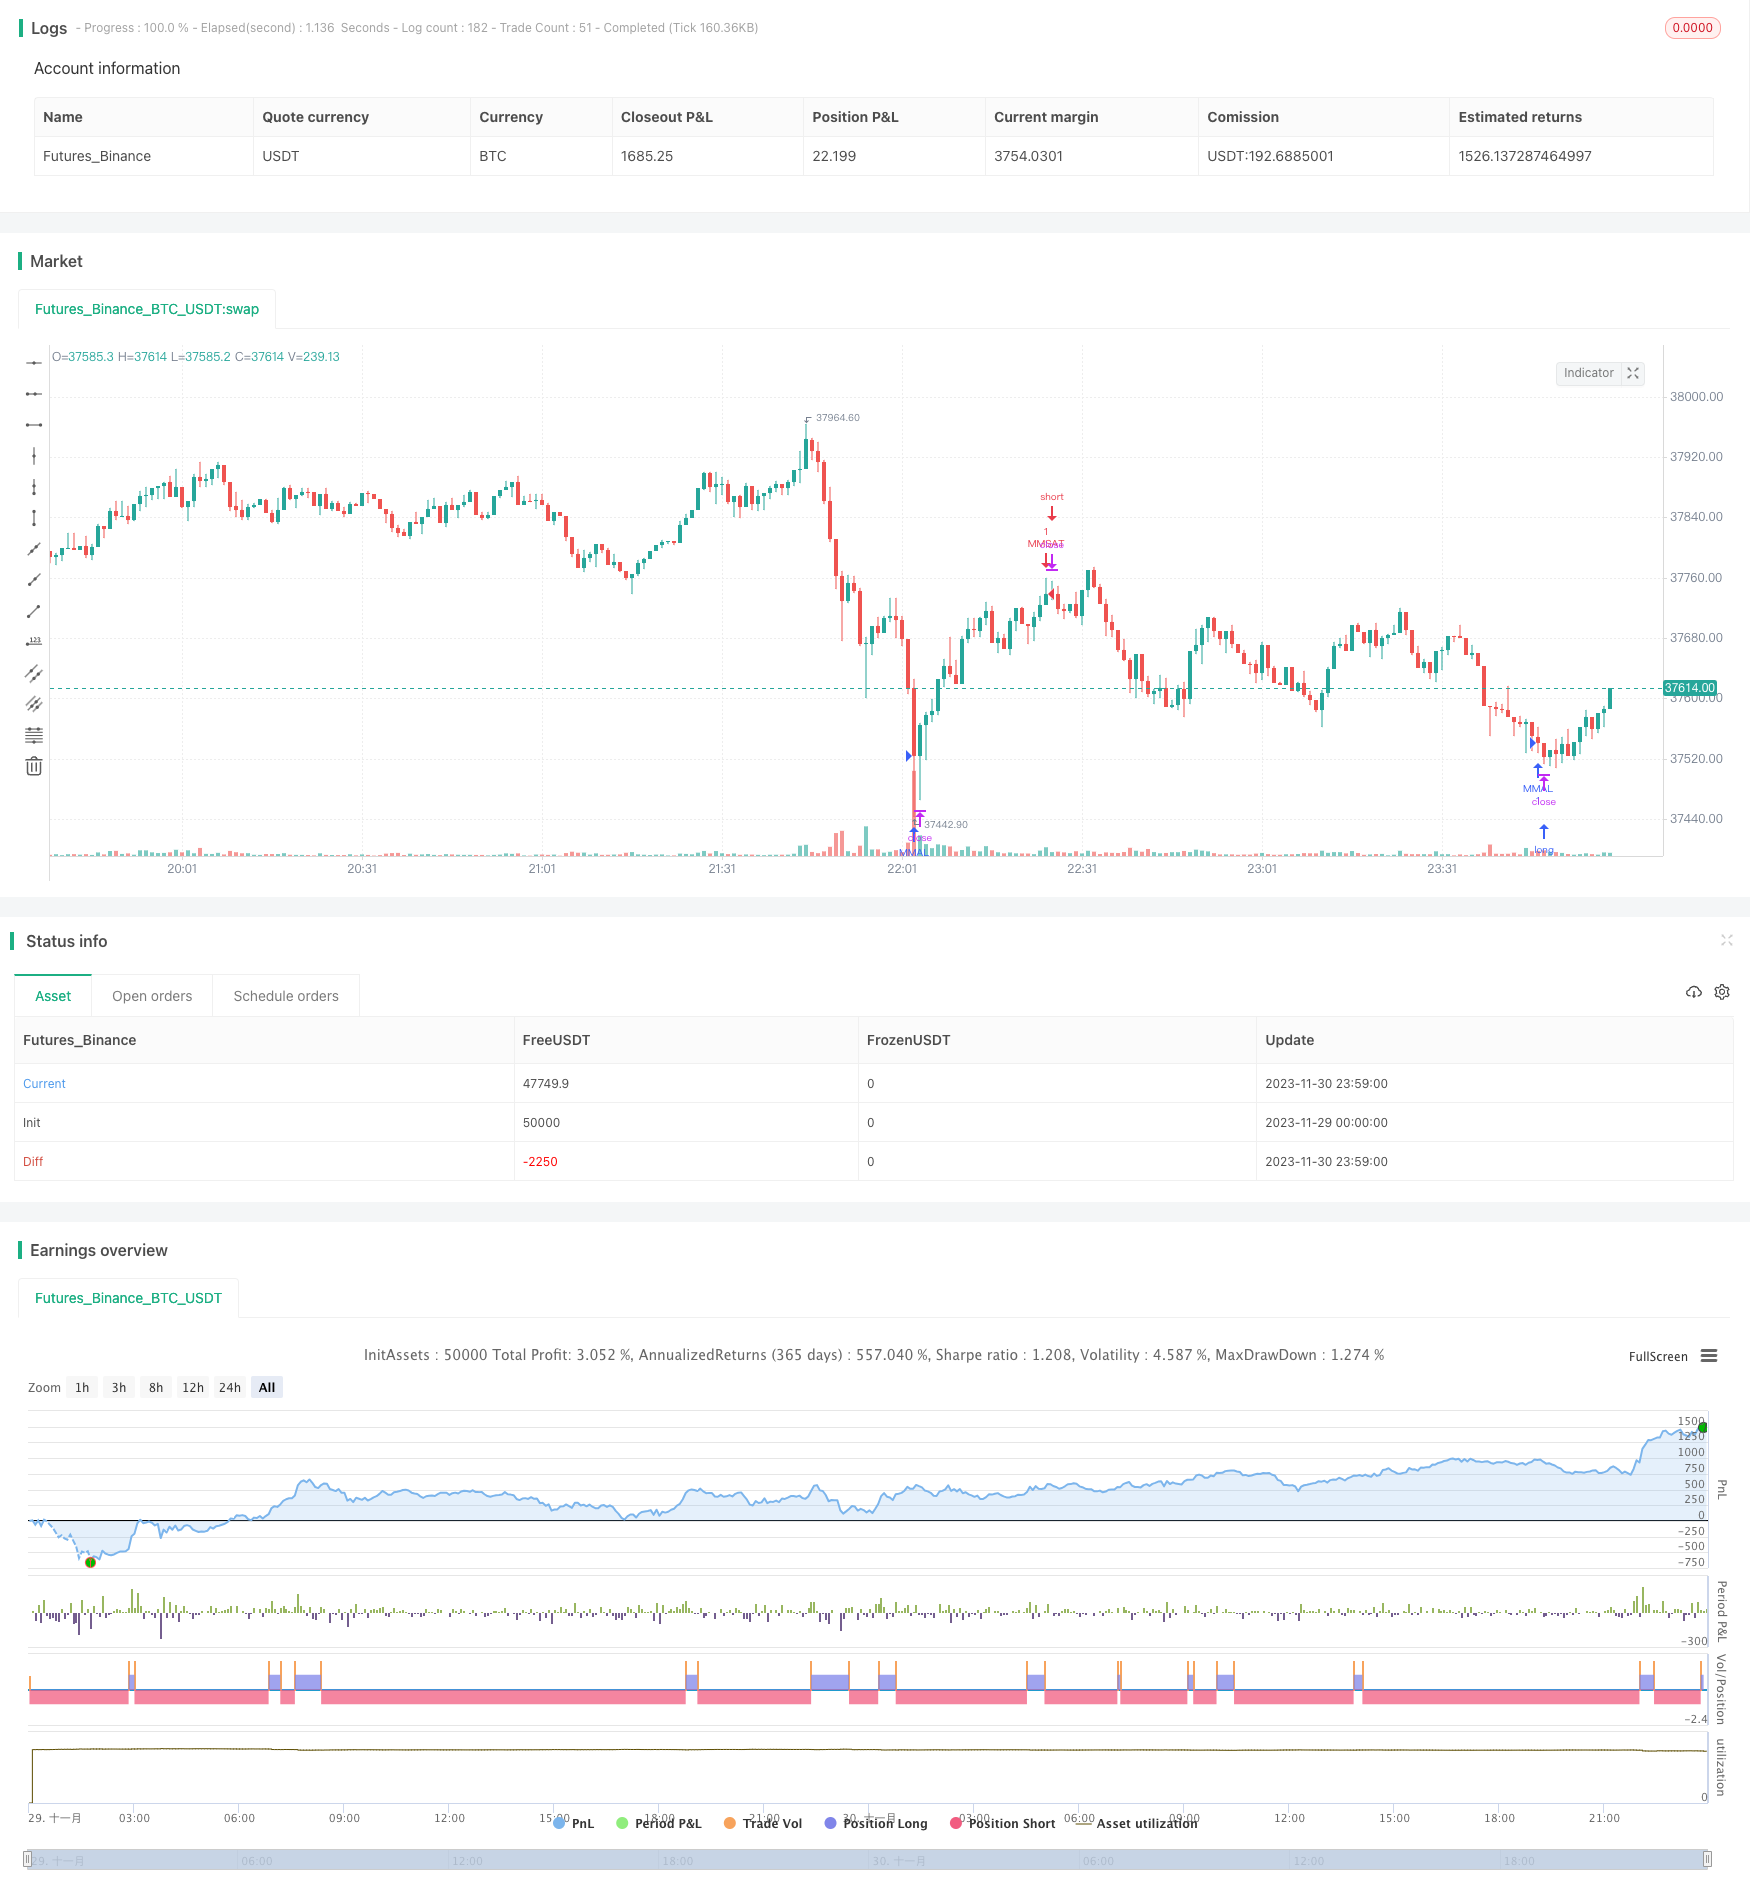
该策略名称为RSI和随机RSI组合策略,它结合了相对强弱指标(RSI)和随机RSI指标的优点,旨在发现超买超卖的机会。该策略适用于5分钟线,在EOS/BTC和BTC/USDT品种效果较好,不适用于所有加密货币。
该策略同时使用RSI指标和随机RSI指标。其中RSI长度为10周期,超买线为60,超卖线为20。随机RSI参数包括K线的平滑周期为3,D线的平滑周期为3,RSI计算周期长度为14,随机RSI计算周期长度为14。当随机RSI的K值和D值同时低于20时为超卖;当随机RSI的K值和D值同时高于80时为超买。策略在超买超卖时机发出交易信号。
该策略结合RSI指标和随机RSI指标的优势。RSI指标能够有效识别超买超卖情况。随机RSI指标结合动量指标,能够更早地发现价格转折点。两者组合使用效果更好,既考虑了价格超买超卖信息,也考虑了动量因素,从而能够在较优时机发出交易信号。
该策略可能存在交易次数过多、幅度不足的风险。解决方法是适当调整参数,降低交易频率,选择交易幅度大的品种。另外,交易费用也会影响最终盈利。建议选择手续费较低的交易平台,或适当放大交易位置规模。
该策略的参数可以进一步优化,如调整RSI参数、随机RSI参数、超买超卖阈值等。此外,可以考虑结合其他指标过滤信号,例如EMA均线指标等,从而提高信号质量。也可以尝试多品种组合,利用不同品种之间的相关性,获得更稳定的整体收益。
该策略整合RSI指标和随机RSI指标的优势,能够在相对超买超卖时发出交易信号。策略参数可进一步优化,交易规则可根据不同品种进行调整,也可以考虑与其他策略或指标组合使用。总体来说,该策略适用于发掘短线交易机会的量化交易者。
||
The strategy is named RSI and Stochastic RSI Combination Strategy. It combines the advantages of Relative Strength Index (RSI) and Stochastic RSI to identify overbought and oversold opportunities. The strategy works well on 5-minute charts for EOS/BTC and BTC/USDT, not suitable for all cryptocurrencies.
The strategy uses both RSI indicator and Stochastic RSI indicator. The RSI parameters are length of 10 periods, overbought level at 60 and oversold level at 20. The Stochastic RSI parameters include smoothing period of K line at 3, smoothing period of D line at 3, RSI calculation length of 14, Stochastic RSI calculation length of 14. It identifies oversold when Stochastic RSI K and D values are both below 20, and overbought when Stochastic RSI K and D values are both above 80. Trading signals are generated at overbought and oversold levels.
The strategy combines the advantages of RSI indicator and Stochastic RSI indicator. RSI is effective at identifying overbought and oversold situations. Stochastic RSI incorporates momentum and can detect turning points earlier. The combination works better by considering both price and momentum factors to generate more timely trading signals.
The strategy may face risks of too many trades and insufficient profit margin per trade. Solutions include properly adjusting parameters to lower trading frequency and selecting products with larger price swings. In addition, trading costs can also impact the final profit. It's recommended to choose trading platforms with lower commissions or appropriately scale up position sizes.
Parameters of this strategy can be further optimized, such as adjusting RSI parameters, Stochastic RSI parameters, overbought/oversold threshold values etc. In addition, other indicators like EMA can be combined to filter signals and improve quality. Trying multi-product combinations to utilize correlations between different products can also help obtain more stable overall returns.
The strategy integrates the advantages of RSI indicator and Stochastic RSI indicator to generate trading signals at relative overbought and oversold levels. Parameters can be further tuned and trading rules can be customized for different products. Combinations with other strategies or indicators can also be explored. Overall speaking, this strategy suits quantitative traders looking to identify short-term trading opportunities.
[/trans]
Strategy Arguments
| Argument | Default | Description |
|---|---|---|
| v_input_1 | 10 | length |
| v_input_2 | 20 | overSold |
| v_input_3 | 60 | overBought |
| v_input_4 | 3 | smoothK |
| v_input_5 | 3 | smoothD |
| v_input_6 | 14 | lengthRSI |
| v_input_7 | 14 | lengthStoch |
| v_input_8_close | 0 | RSI Source: close |
| v_input_9 | 20 | srsilow |
| v_input_10 | 80 | srsiup |
| v_input_11 | 2018 | yearfrom |
| v_input_12 | 2019 | yearuntil |
| v_input_13 | true | monthfrom |
| v_input_14 | 12 | monthuntil |
| v_input_15 | true | dayfrom |
| v_input_16 | 31 | dayuntil |
Source (PineScript)
/*backtest
start: 2023-11-29 00:00:00
end: 2023-12-01 00:00:00
period: 1m
basePeriod: 1m
exchanges: [{"eid":"Futures_Binance","currency":"BTC_USDT"}]
*/

//@version=3
strategy("RSI+STOCHRSI", overlay=true)
length = input( 10)
overSold = input( 20 )
overBought = input( 60 )
price = close
vrsi = rsi(price, length)

smoothK = input(3, minval=1)
smoothD = input(3, minval=1)
lengthRSI = input(14, minval=1)
lengthStoch = input(14, minval=1)
src = input(close, title="RSI Source")

rsi1 = rsi(src, lengthRSI)
k = sma(stoch(rsi1, rsi1, rsi1, lengthStoch), smoothK)
d = sma(k, smoothD)
srsilow=input(20)
srsiup=input(80)

sourceup = high
sourcelow = low
source=close


yearfrom = input(2018)
yearuntil =input(2019)
monthfrom =input(1)
monthuntil =input(12)
dayfrom=input(1)
dayuntil=input(31)


if (  (d<srsilow) and (k<srsilow) and (vrsi<overSold))
    strategy.entry("MMAL", strategy.long, stop=close, oca_name="TREND", comment="AL")
else
    strategy.cancel(id="MMAL")


if ( (d> srsiup ) and (k>srsiup ) and (vrsi >overBought) )
    strategy.entry("MMSAT", strategy.short,stop=close, oca_name="TREND",  comment="SAT")
else
    strategy.cancel(id="MMSAT")
Detail
https://www.fmz.com/strategy/434561
Last Modified
2023-12-07 15:44:21
