Name
RSI和SMA交叉策略RSI-and-SMA-Crossover-Strategy
Author
ChaoZhang
Strategy Description
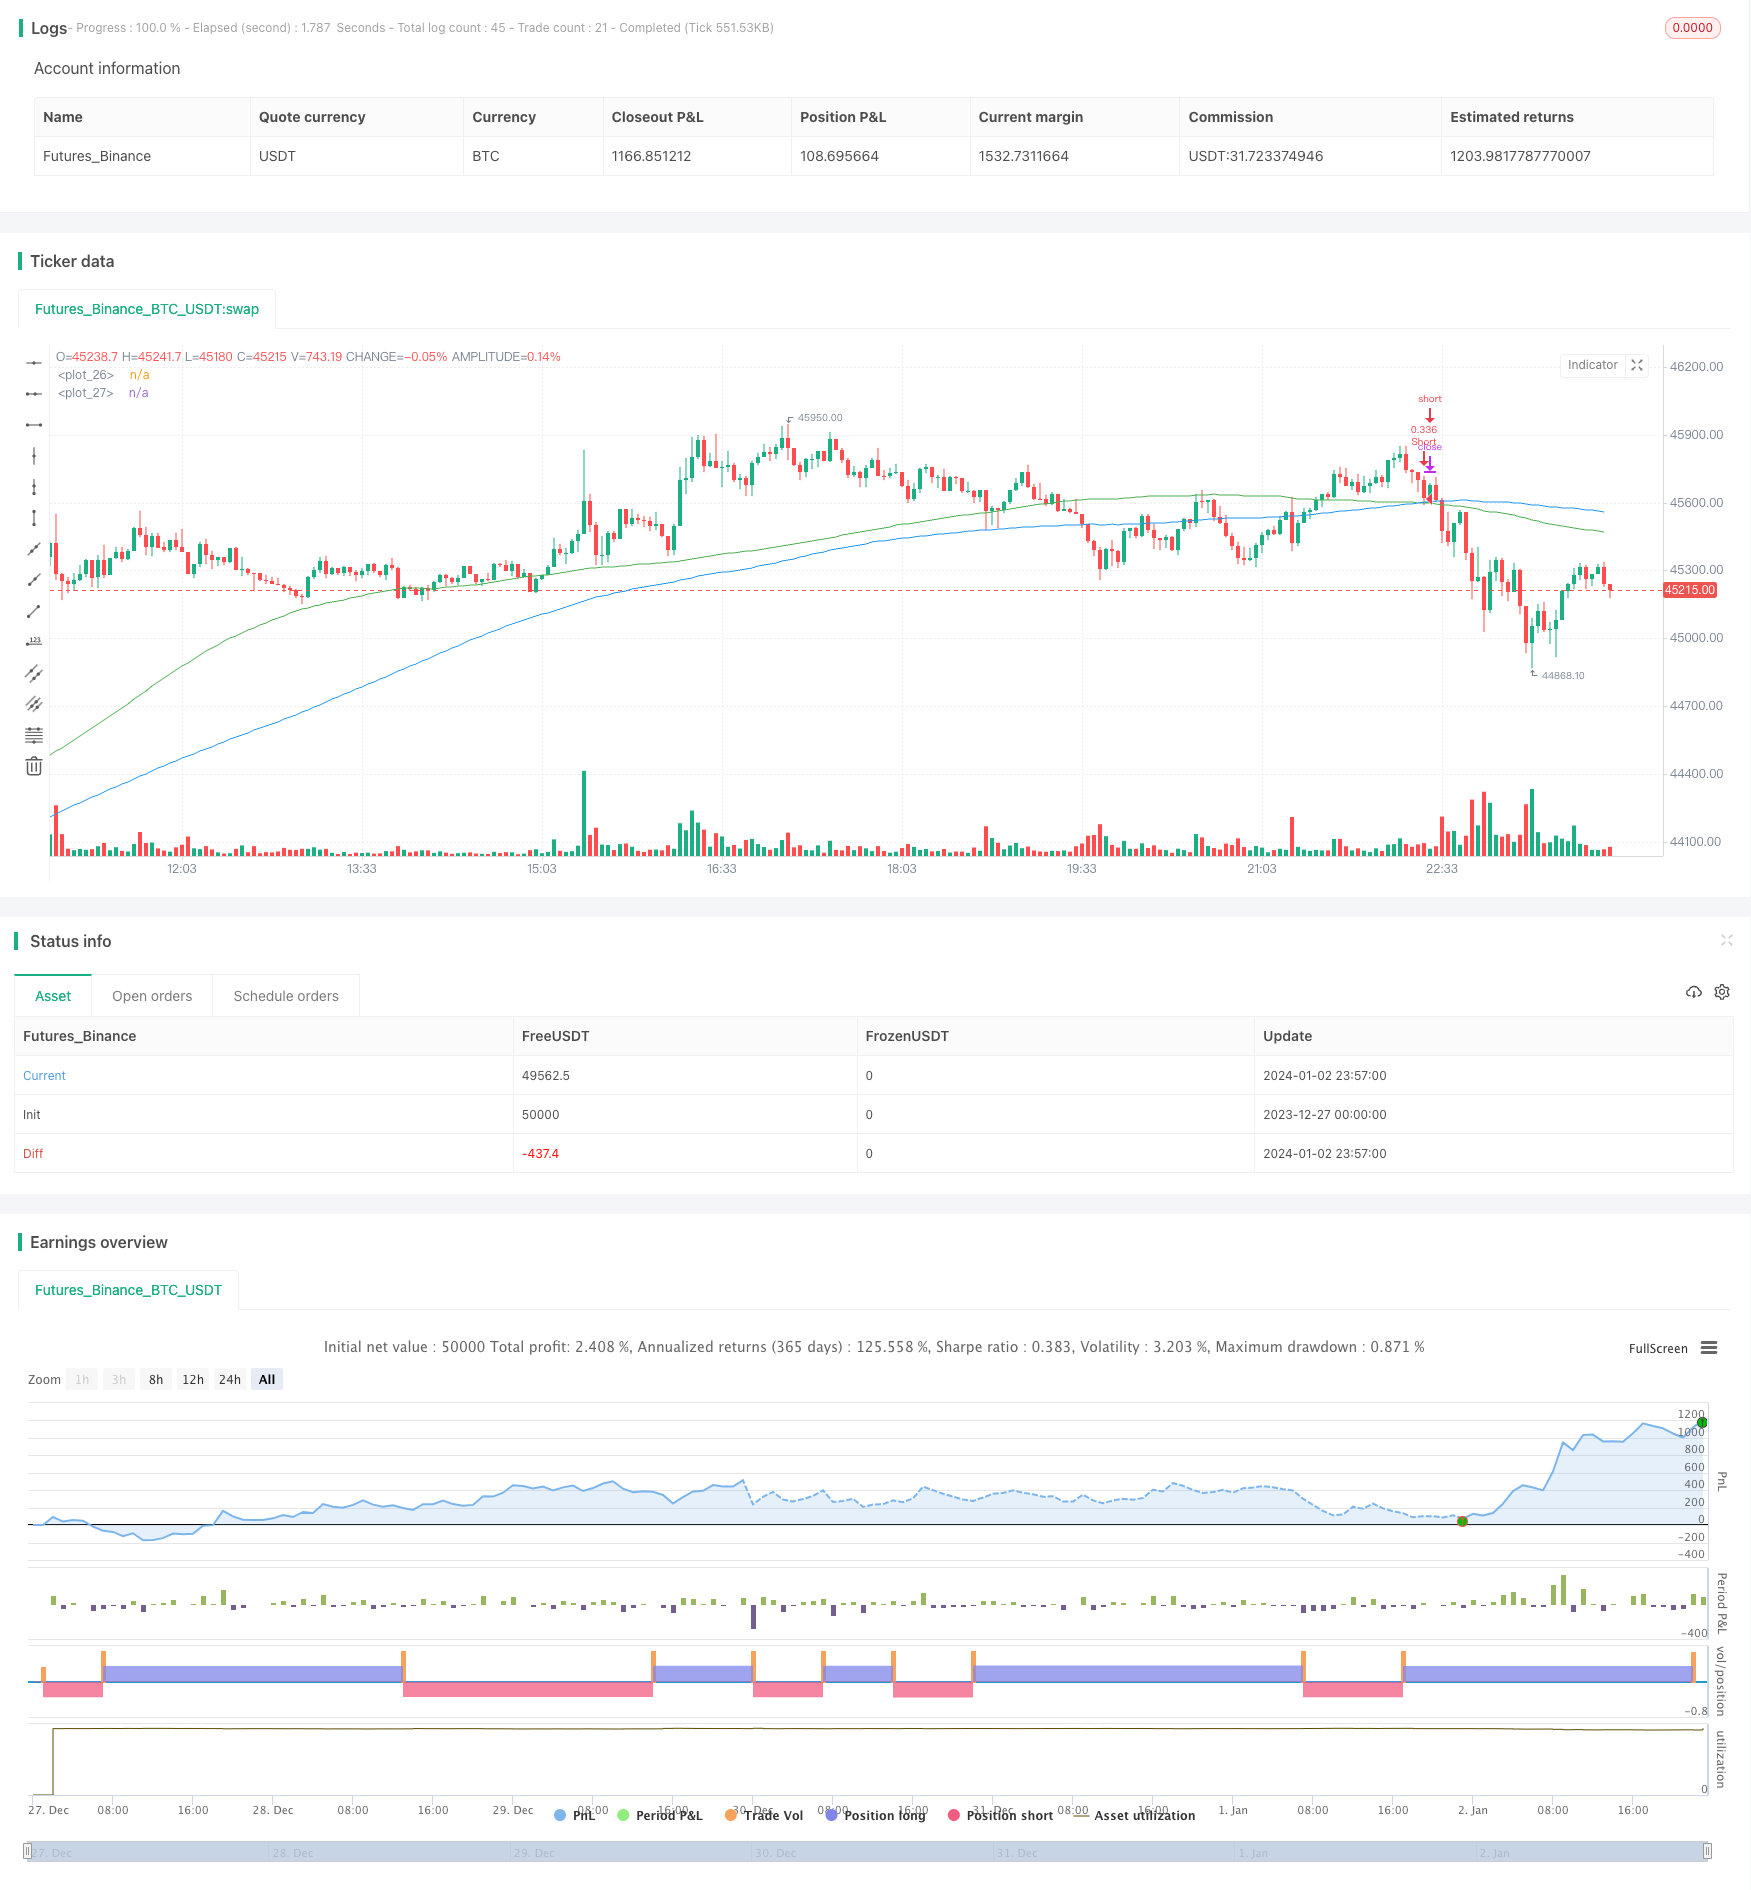
本策略 named为“RSI和SMA金叉死叉策略”,其核心思想是利用RSI指标判断超买超卖,并结合SMA均线的金叉死叉形成交易信号。当RSI高于50并且短期SMA高于长期SMA时做多,当RSI低于50并且短期SMA低于长期SMA时做空。
该策略主要利用了RSI指标和SMA均线的组合来形成交易信号。其中,RSI指标用于判断证券价格的超买超卖情况。RSI指数高于50表示为超买区,低于50表示为超卖区。SMA均线的金叉死叉也常用于判断买卖时机。本策略就是将RSI指标和SMA均线的交叉信号结合在一起,形成交易决策依据。
具体来说,当RSI指标高于50(超买区)并且短期SMA均线上穿长期SMA均线(金叉)时,则做多;当RSI指标低于50(超卖区)并且短期SMA均线下穿长期SMA均线(死叉)时,则做空。这样既利用了RSI判断超买超卖的功能,又利用了SMA均线的金叉死叉信号,两者结合可以提高决策的准确性。
相比单一利用RSI指标或者SMA均线,本策略结合两者的优势有:
-
可以更准确判断价格的超买超卖情况。仅看SMA均线时,价格可能已经进入超买超卖区域;仅看RSI时,并不能完全判断价格走势的转折。两者结合可以形成比较完整的判断依据。
-
可以过滤掉部分噪音信号。仅凭SMA均线的金叉死叉可能会出现一些错误信号,而结合RSI指标可以过滤这些噪音。
-
可以把握趋势的更多机会。在行情出现明确趋势时,仅凭RSI可能会错过部分机会,而结合SMA均线则可以持续跟踪趋势参与更大行情。
总的来说,RSI和SMA的组合可以相互补充形成更为完整的交易决策依据,在捕捉趋势的同时也可以减少错误信号,从而可能获得更好的回测指标。
本策略也存在一些潜在风险需要注意:
-
参数设置风险。RSI周期和SMA均线的长短需要设置得当,如果参数设置不当则会出现交易信号错乱的情况。
-
特殊行情风险。在某些特殊行情下指标可能会失效,如价格Limit Up/Down时、停牌复牌后的价格跳空等情况。这时交易信号可能会出现错误。
-
回撤风险。在行情出现较大回调时,策略账户也会产生一定回撤。可以通过加大头寸管理来控制这方面的最大损失。
-
实现难度风险。RSI和SMA均线相对简单,但要调整参数并达到实际盈利还需要一定的技巧与经验。
本策略还可以从以下几个方面进行优化:
-
测试不同参数下的优化组合。可以尝试不同长度周期的RSI与SMA,找到最佳参数组合。
-
加入止损策略。如设立移动止损、缩量止损等方式来锁定盈利、控制风险。
-
结合其他指标过滤信号。如MACD、布林带等指标可用来辅助确认交易信号,减少错误。
-
不同品种参数差异化。部分品种参数设置可以进行差异化优化以获得最佳结果。
-
优化仓位管理策略。如iskycan等高级开仓方式,或设立波动率位置调整机制等。
本策略通过结合RSI指标和SMA均线的交叉进行决策,既可以判断价格的超买超卖又可以抓住趋势机会。相比单一指标,具有判断更为准确、过滤噪音更出色的优点。同时也需要注意控制回撤、优化参数组合等风险,通过持续优化可以获得更好的策略效果。总的来说该策略简单实用,是量化交易的一个很典型的策略思路。
||
This strategy named "RSI and SMA Crossover Strategy", its core idea is to use the RSI indicator to judge overbought and oversold conditions, and combine the golden cross and dead cross of SMA lines to generate trading signals. Go long when RSI is higher than 50 and short term SMA is higher than long term SMA, go short when RSI is lower than 50 and short term SMA is lower than long term SMA.
This strategy mainly combines the RSI indicator and the SMA moving average to form trading signals. The RSI indicator is used to judge the overbought and oversold conditions of security prices. RSI index higher than 50 indicates an overbought area, and lower than 50 indicates an oversold area. The golden cross and dead cross of SMA lines are also commonly used to determine buy and sell timing. This strategy combines the cross signals of the RSI indicator and SMA lines to form the basis for trading decisions.
Specifically, when the RSI indicator is higher than 50 (overbought area) and the short-term SMA crosses above the long-term SMA (golden cross), go long; when the RSI indicator is lower than 50 (oversold area) and the short-term SMA crosses below the long-term SMA (dead cross), go short. This utilizes both the RSI's ability to judge overbought and oversold conditions, as well as the SMA lines' golden cross and dead cross signals, so that combining the two can improve the accuracy of decisions.
Compared with using the RSI indicator or SMA lines alone, the advantages of combining the two in this strategy include:
-
It can more accurately judge the overbought and oversold conditions of prices. Looking at the SMA lines alone, the price may have already entered the overbought or oversold zone; looking at RSI alone cannot fully determine turns in price trends. Combining the two can form a more complete basis for judgments.
-
It can filter out some noisy signals. Relying solely on the SMA lines' golden crosses and dead crosses, some wrong signals may appear. Combining with the RSI indicator can filter out this noise.
-
It can capture more trend opportunities. In the event of a clear trend in the market, relying solely on RSI may miss some opportunities, while combining SMA lines can continue to track and participate in bigger market moves.
In summary, the combination of RSI and SMA complements each other to form a more complete basis for trading decisions. It can capture trends while reducing incorrect signals, thus potentially yielding better backtesting metrics.
This strategy also has some potential risks to be aware of:
-
Parameter setting risk. The periods for RSI and lengths of the SMA lines need to be set appropriately. Incorrect settings may lead to messy trading signals.
-
Special market conditions risk. Under certain special market conditions, the indicators may fail, such as limit up/down of prices, price gaps after suspensions, etc. Signals may be incorrect in these cases.
-
Drawdown risk. In the event of larger market pullbacks, the strategy account will also face drawdowns to some extent. This can be controlled by increasing position sizing management.
-
Implementation difficulty risk. Though RSI and SMA lines are relatively simple, fine tuning the parameters and actual profitability requires certain skills and experience.
This strategy can also be optimized in the following aspects:
-
Test optimal combination under different parameter settings. Try different period lengths for RSI and SMA to find the optimum.
-
Add stop loss mechanisms, such as trailing stop loss, percentage based stops etc to lock in profits and control risk.
-
Combine with other indicators to filter signals, such as MACD, Bollinger Bands etc to confirm trades and reduce errors.
-
Differentiate parameters by product. Some products may need differentiated optimization of parameters for best results.
-
Optimize position sizing schemes, such as iSkycan, volatility adjusted sizing etc.
This strategy makes decisions by combining the crossover signals of RSI and SMA, allowing judgement of overbought/oversold conditions while also capturing trend opportunities. Compared to single indicators, it has the advantage of more accurate judgements and noise filtering. At the same time, controlling drawdowns, optimizing parameter combinations and other risks need to be noted as well. With continuous optimization, better strategy performance can be obtained. In summary, this is a simple and practical strategy that demonstrates a typical quantitative trading strategy logic flow.
[/trans]
Strategy Arguments
| Argument | Default | Description |
|---|---|---|
| v_input_1 | true | Show Date Range |
| v_input_2 | 14 | length |
Source (PineScript)
/*backtest
start: 2023-12-27 00:00:00
end: 2024-01-03 00:00:00
period: 3m
basePeriod: 1m
exchanges: [{"eid":"Futures_Binance","currency":"BTC_USDT"}]
*/

/// This source code is subject to the terms of the Mozilla Public License 2.0 at https://mozilla.org/MPL/2.0/
// © ExpertCryptoo1

//@version=5
strategy('RSI and SMA',
         overlay=true,
         initial_capital=1000,
         process_orders_on_close=true,
         default_qty_type=strategy.percent_of_equity,
         default_qty_value=30,
         commission_type=strategy.commission.percent,
         commission_value=0.1)

showDate = input(defval=true, title='Show Date Range')
timePeriod = time >= timestamp(syminfo.timezone, 2022, 1, 1, 0, 0)
notInTrade = strategy.position_size <= 0

//==================================Buy Conditions============================================
//RSI
length = input(14)
rsi = ta.rsi(close, length)

//SMA
fastEMA = ta.sma(close, 100)
slowEMA = ta.sma(close, 150)
plot(fastEMA, color = color.green)
plot(slowEMA, color = color.blue)


bullish = ta.crossover(fastEMA, slowEMA) and rsi > 50
bearish = ta.crossover(slowEMA, fastEMA) and rsi < 50

strategy.entry("Long", strategy.long, when=bullish and timePeriod)
strategy.close("Exit", when=bearish)

strategy.entry("Short", strategy.short, when=bearish and timePeriod)
strategy.close("Exit", when=bullish)
Detail
https://www.fmz.com/strategy/437631
Last Modified
2024-01-04 14:33:24
