Name
RSI均线交叉趋势策略RSI-Moving-Average-Crossover-Trend-Strategy
Author
ChaoZhang
Strategy Description
[trans]
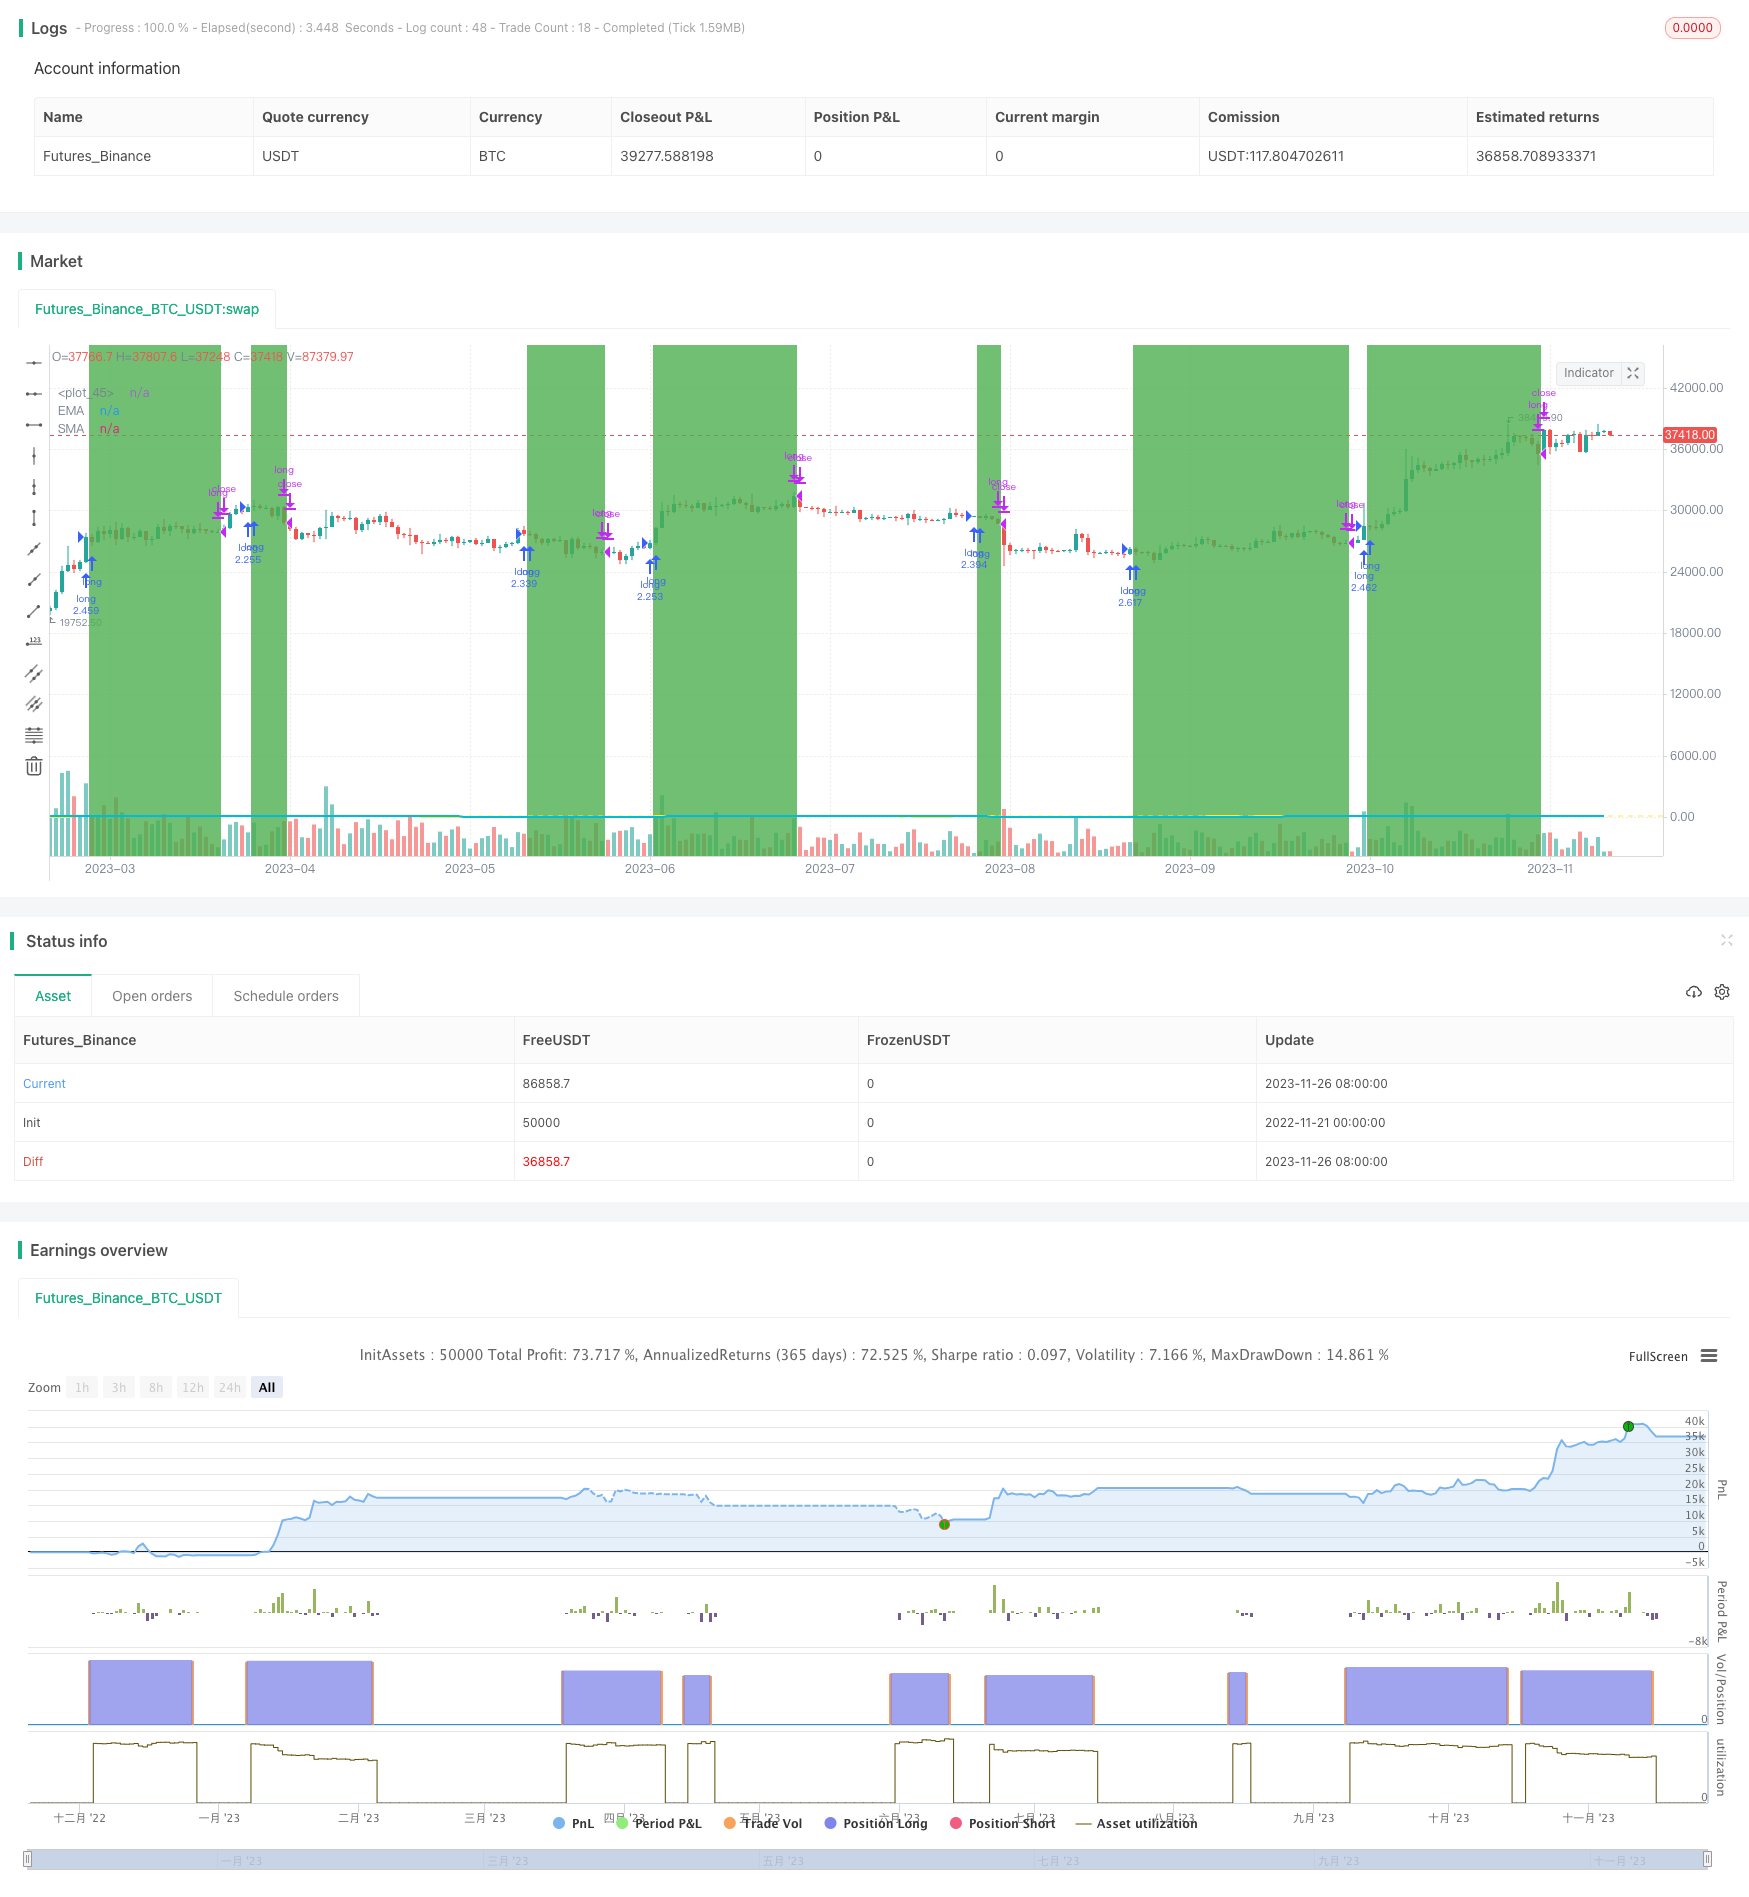
RSI均线交叉趋势策略(RSI Moving Average Crossover Trend Strategy)是一个利用RSI指标的均线交叉信号来判断趋势和发出交易信号的策略。该策略同时结合价格的EMA,只有当价格高于EMA的时候,才会发出买入信号。
该策略的核心指标是RSI,同时计算RSI的EMA和SMA两条均线。只有当RSI的EMA线高于SMA线而价格高于EMA时,才会发出买入信号;当RSI的EMA线低于SMA线时,会发出卖出信号,实施趋势跟踪。
RSI指标能够有效反映市场的超买超卖现象。RSI指标上突破70视为市场超买,而下破30则被视为超卖。该策略运用EMA和SMA两条移动平均线来发现RSI指标的趋势和转折点。EMA线对最新价格变化更为敏感,而SMA线对老数据的依赖更高,二者能够形成配合。
当RSI的EMA开始上扬,说明市场出现盘整企稳迹象,此时用SMA来验证其方向;当SMA也开始上扬,说明RSI明确进入上升趋势,这时策略会在价格高于EMA的前提下发出买入信号,跟踪趋势。
这是一个跟踪趋势的策略,能够有效抓住中长线的方向性机会。相比单一指标,该策略运用RSI的EMA和SMA形成交叉验证,可以减少错误信号和增强稳定性。
该策略还结合价格的EMA以确保只在价格上升趋势中买入,避免震荡行情的风险,从而提高盈利概率。
该策略主要基于RSI指标,当RSI产生错误信号时,该策略也会跟随发出错误信号。此外,RSI指标更适用于判断超买超卖现象,对判断中长线趋势有一定的滞后性。
该策略也存在一定的时间滞后,特别是当RSI的EMA和SMA均值偏平盘整时,会导致信号推迟。这段期间亦存在一定亏损的风险。
-
可以考虑对RSI进行优化,选取更加合适的参数,增强其判断效果。
-
可以考虑加入止损逻辑,在亏损达到一定幅度后退出仓位,有效控制风险。
-
可以测试不同时间周期的参数设置,优化参数,使策略在更多品种和更多周期上都能稳定运行。
RSI均线交叉趋势策略,是一种简单的利用RSI指标判断趋势方向和交叉验证的策略。它结合价格EMA,能够在上升趋势中抓住方向性机会。该策略稳定性较高,适合中长线持有,但也需要注意防范一定的滞后风险。通过进一步优化,可以使该策略的表现更加出色。
||
The RSI Moving Average Crossover Trend Strategy is a strategy that uses the moving average crossover signals of the RSI indicator to determine the trend and issue trading signals. The strategy also incorporates the price EMA, issuing buy signals only when the price is above the EMA.
The core indicator of this strategy is RSI. It calculates both the EMA and SMA of the RSI. Buy signals are only issued when the RSI EMA is above the SMA while the price is above the EMA. Sell signals are issued when the RSI EMA falls below the SMA to follow the trend.
The RSI indicator can effectively reflect overbought and oversold conditions in the market. Breaking above 70 on the RSI is regarded as overbought while breaking below 30 is oversold. This strategy utilizes the EMA and SMA to discover trends and turning points of the RSI indicator. The EMA reacts faster to recent price changes while the SMA relies more on older data. The two lines work together.
When the RSI EMA starts picking up, it signals stabilization in the market. The SMA then verifies the direction. When the SMA also starts rising, it confirms the RSI is in an uptrend. The strategy will now issue a buy signal given that the price is above EMA to follow the trend.
This is a trend following strategy, capable of effectively catching directional opportunities over the medium to long term. Compared to single indicators, this strategy uses RSI EMA and SMA crossover for verification, reducing false signals and increasing stability.
The strategy also incorporates the price EMA to ensure buying only in a price uptrend, avoiding the risk of range-bound markets and improving profitability.
The strategy relies mainly on the RSI indicator. False RSI signals will lead to false strategy signals. Also, the RSI is more suitable for identifying overbought/oversold levels with some lag in catching mid-long term trends.
There can also be some time lag, especially when the RSI EMA and SMA are more range-bound. This period carries some loss risk before signals are triggered.
-
The RSI can be optimized by selecting more appropriate parameters to enhance effectiveness.
-
Stop loss logic can be added to exit positions after losses reach certain levels to effectively manage risk.
-
Parameters can be tested and optimized across different timeframes so that the strategy can run stable on more products and periods.
The RSI Moving Average Crossover Trend Strategy is a simple trend following strategy using RSI to determine trend direction and crossovers for verification. It incorporates price EMA to buy on uptrends. The strategy has high stability for mid-long term holding but lag risk needs to be managed. Further optimizations can improve strategy performance.
[/trans]
Strategy Arguments
| Argument | Default | Description |
|---|---|---|
| v_input_1 | 5 | From Month |
| v_input_2 | true | From Day |
| v_input_3 | 2015 | From Year |
| v_input_4 | true | To Month |
| v_input_5 | true | To Day |
| v_input_6 | 9999 | To Year |
| v_input_7 | 16 | RSILength |
| v_input_8 | 12 | RSI EMA Length |
| v_input_9 | 29 | RSI SMA Length2 |
| v_input_10 | 8 | EMA price Length |
Source (PineScript)
/*backtest
start: 2022-11-21 00:00:00
end: 2023-11-27 00:00:00
period: 1d
basePeriod: 1h
exchanges: [{"eid":"Futures_Binance","currency":"BTC_USDT"}]
*/

//@version=4
//Created by Sv3nla 5-Jan-2021
strategy(title="Sv3nla RSI EMA SMA Strat", shorttitle="Sv3nla RSI EMA SMA Strat", overlay=true, initial_capital=1000, default_qty_type=strategy.percent_of_equity, default_qty_value=100)

// === BACKTEST RANGE ===
FromMonth = input(defval = 5, title = "From Month", minval = 1)
FromDay   = input(defval = 1, title = "From Day", minval = 1)
FromYear  = input(defval = 2015, title = "From Year", minval = 2015)
ToMonth   = input(defval = 1, title = "To Month", minval = 1)
ToDay     = input(defval = 1, title = "To Day", minval = 1)
ToYear    = input(defval = 9999, title = "To Year", minval = 2022)
// syminfo.mintick = 0.01$ for BTCUSDT

testPeriod() => true

//INPUTS
rsilen = input(defval = 16, minval=1, title="RSILength")
RSIemaLen = input(defval = 12, minval=1, title="RSI EMA Length")
RSIsmaLen2 = input(defval = 29, minval=1, title="RSI SMA Length2")
length = input(defval = 8, minval=1, title="EMA price Length")

// RSI
RSIsrc = close
RSIup = rma(max(change(RSIsrc), 0), rsilen)
RSIdown = rma(-min(change(RSIsrc), 0), rsilen)
rsi = RSIdown == 0 ? 100 : RSIup == 0 ? 0 : 100 - 100 / (1 + RSIup / RSIdown)
emavalue=ema(rsi,RSIemaLen)
smavalue=sma(rsi,RSIsmaLen2)

//EMA
ema=ema(close,length)

//PLOT
plot(ema(rsi, RSIemaLen), color=color.yellow, linewidth=2, title="EMA", transp=0)
plot(sma(rsi, RSIsmaLen2), color=color.aqua, linewidth=2, title="SMA", transp=0)

//ORDERS
if (testPeriod())
    strategy.entry("long",strategy.long, comment="RSIEMA", when=(emavalue > smavalue and close>ema))
    strategy.close(id="long", when=(emavalue < smavalue))

// Colour background when in a trade and 50 horizontal line
backgroundColour = (strategy.position_size > 0) ? color.green : na
bgcolor(color=backgroundColour, transp=85)
hline(50, color=color.yellow)
Detail
https://www.fmz.com/strategy/433590
Last Modified
2023-11-28 17:03:56
