Name
RSI均线双金叉震荡策略RSI-Moving-Average-Double-Cross-Oscillation-Strategy
Author
ChaoZhang
Strategy Description
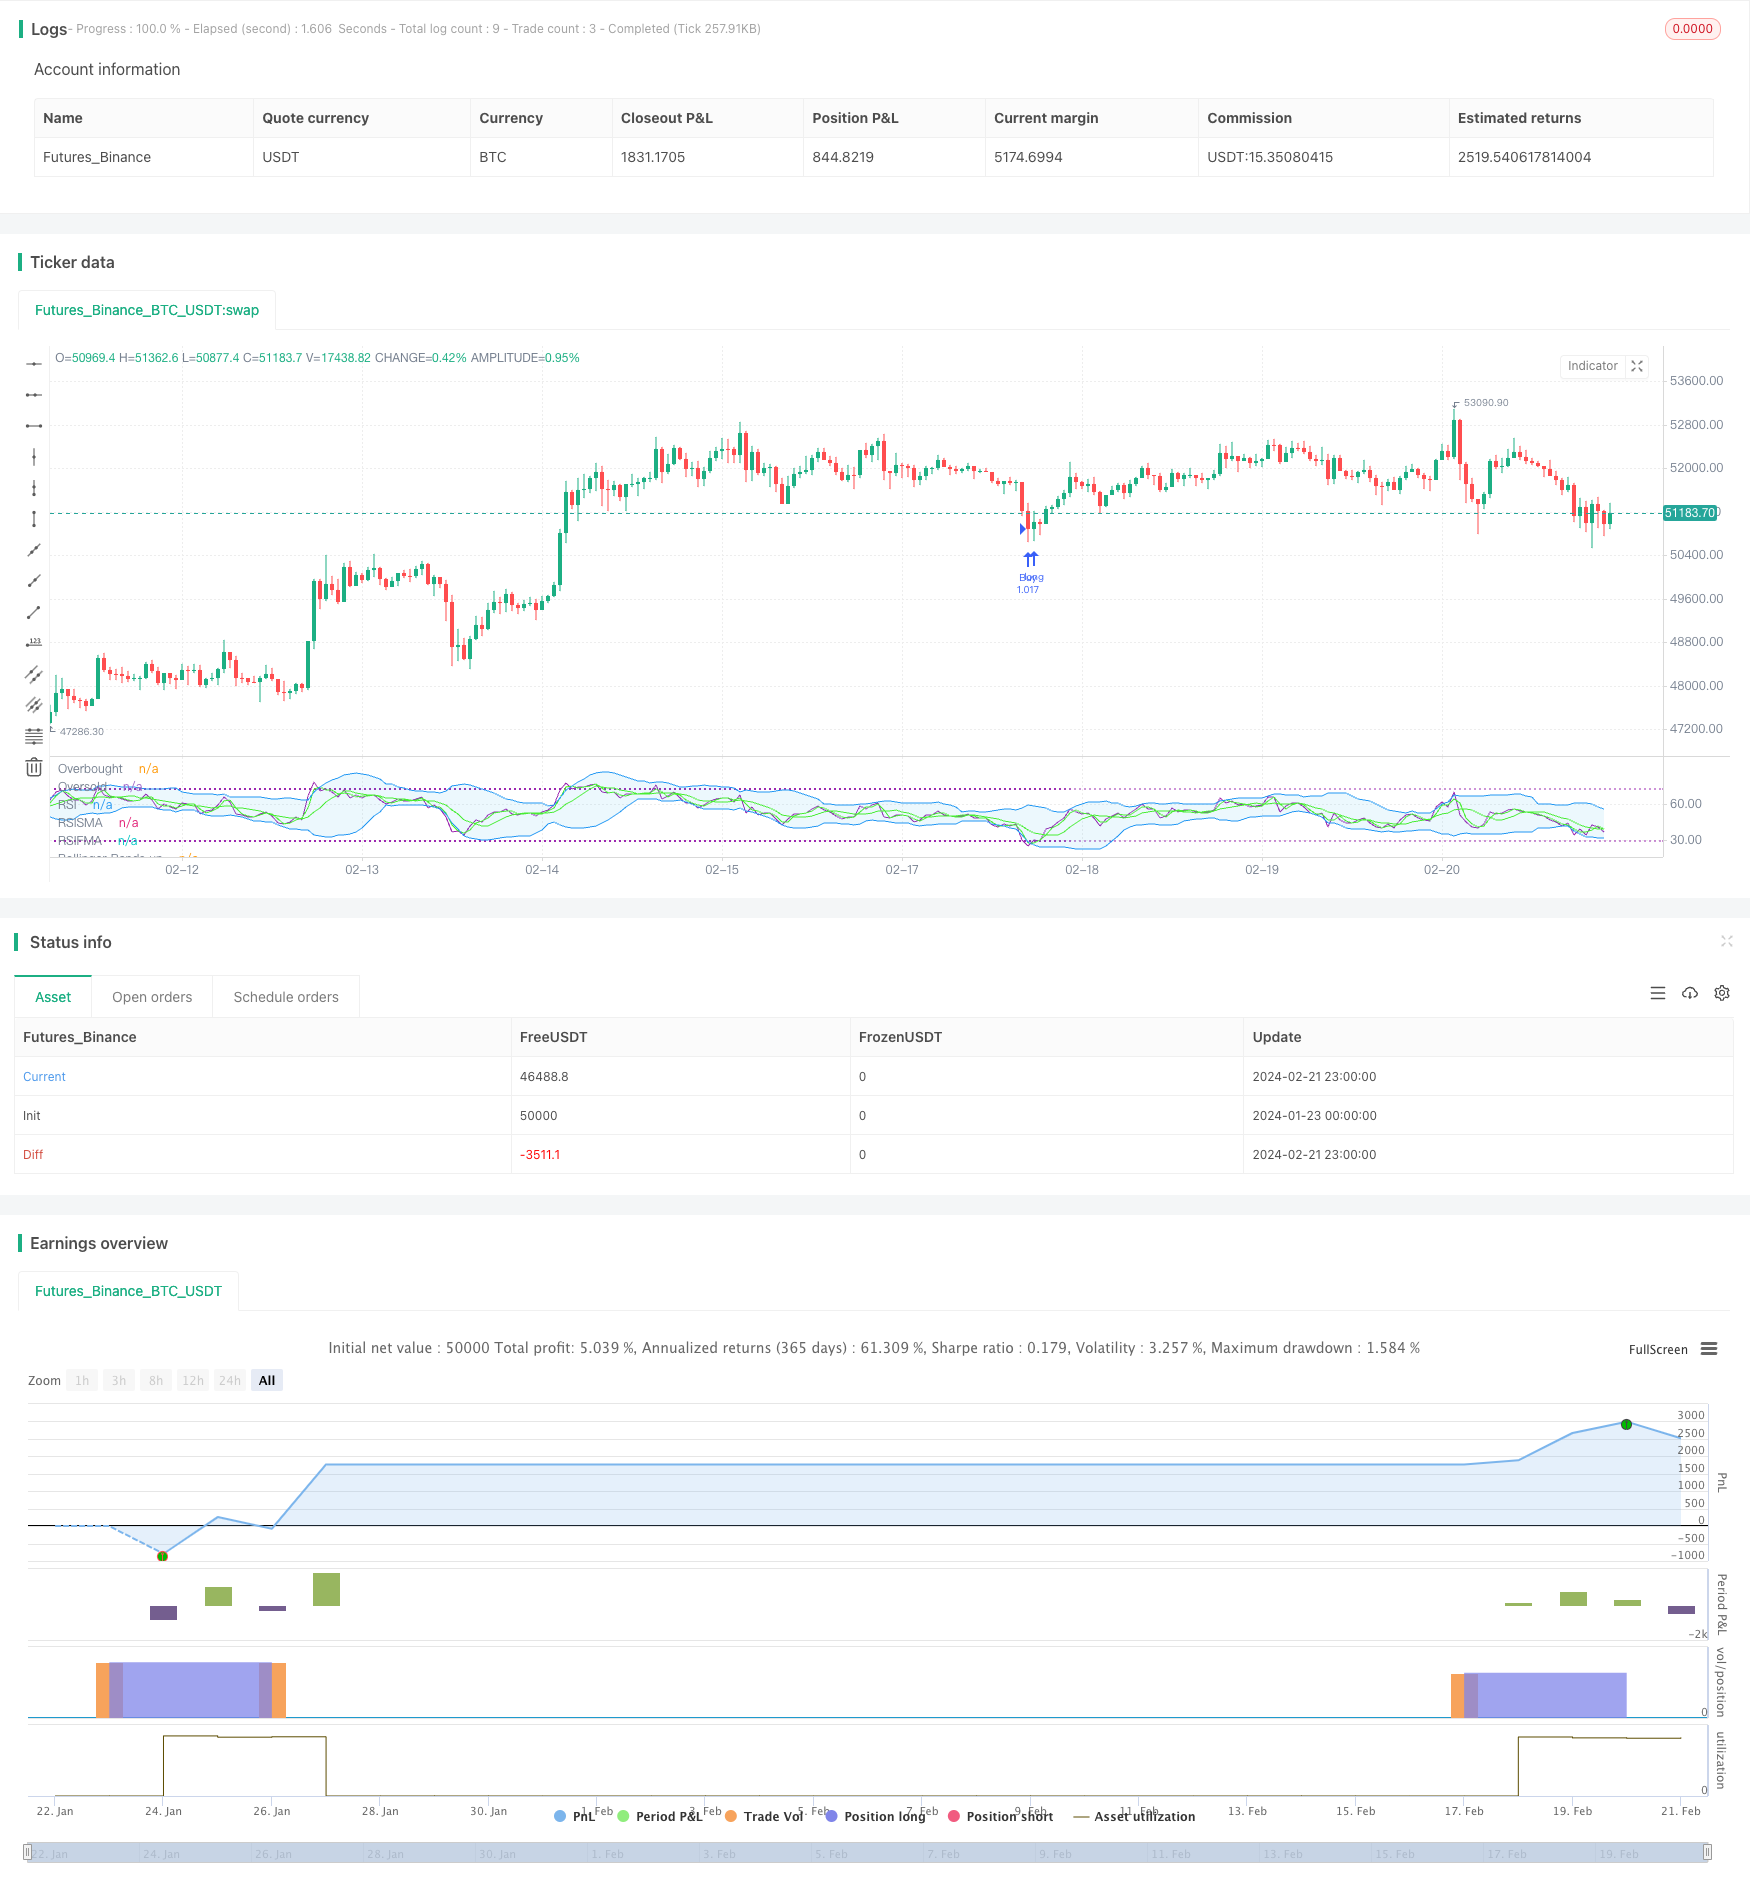
RSI均线双金叉震荡策略是一种同时利用RSI指标与均线的金叉死叉信号来决定买入卖出的量化交易策略。该策略运用RSI指标判断市场是否被高估或低估,并结合均线的趋势判断,在RSI指标显示超买超卖现象的同时发出交易信号。这可以有效过滤假信号,提高策略的稳定性。
该策略主要基于RSI指标与均线的组合使用。首先计算一定周期的RSI值,并设置超买超卖线。其次,计算快速均线及慢速均线。当RSI指标上穿上慢速均线,同时RSI值低于超卖线及下轨时产生买入信号;当RSI指标下穿下慢速均线,同时RSI值高于超买线及上轨时产生卖出信号。
这种策略最大的优势就是同时利用RSI指标判断超买超卖现象,以及均线判断趋势方向,能有效避免假突破。此外,RSI与BOLL通道的组合运用也可以进一步过滤噪音,使交易信号更加准确。
该策略可能存在的风险主要有:操作频率过高,容易迭仓;参数设置不当可能导致信号精确度降低。此外,震荡行情下也可能出现亏损。
可以考虑调整RSI参数或均线周期参数以适应不同周期;结合其他指标过滤信号;设置止损止盈点以控制风险;优化每次交易的仓位管理。
RSI均线双金叉震荡策略整体来说是一种较为稳定可靠的短线交易策略。通过参数调优与风险控制的配合,可以获得较好的收益回报率。该策略易于理解与实现,非常适合量化交易初学者学习与应用。
||
The RSI moving average double cross oscillation strategy is a quantitative trading strategy that uses both the crossovers of RSI indicator and moving averages to determine entries and exits. It utilizes the RSI indicator to judge whether the market is overbought or oversold, combined with the trend judgment of moving averages, to issue trading signals when RSI shows extreme conditions. This can effectively filter out fake signals and improve the stability of the strategy.
The strategy is mainly based on the combined use of the RSI indicator and moving averages. Firstly, calculate the RSI value over a certain period and set overbought/oversold lines. Secondly, calculate fast and slow moving averages. When the RSI crosses above the slow moving average, while the RSI value is below the oversold line and lower band, a buy signal is generated; When the RSI crosses below the slow moving average, while the RSI is above the overbought line and upper band, a sell signal is generated.
The biggest advantage of this strategy is that it utilizes both the RSI indicator to judge overbought/oversold conditions and moving averages to determine trend direction, which can effectively avoid false breakouts. In addition, the combination of RSI and BOLL channel can further filter noise to make trading signals more accurate.
The main risks of this strategy may include: high trading frequency leading to over-trading; improper parameter settings may reduce signal accuracy. In addition, losses may occur in range-bound markets.
Consider adjusting RSI or moving average period parameters to suit different cycles; Combine with other indicators to filter signals; Set stop loss and take profit to control risks; Optimize position sizing on every trade.
In general, the RSI moving average double cross oscillation strategy is a relatively stable and reliable short-term trading strategy. With proper parameter tuning and risk control, it can achieve good return on investment. The strategy is easy to understand and implement, very suitable for beginners to learn and apply quantitative trading.
[/trans]
Strategy Arguments
| Argument | Default | Description |
|---|---|---|
| v_input_1 | 14 | RSI Length |
| v_input_2 | 7 | Fast |
| v_input_3 | 2 | Slow |
| v_input_4 | 72 | RSI Overbought Level |
| v_input_5 | 29 | RSI Oversold Level |
| v_input_6 | 14 | Bollinger Bands Length |
| v_input_7 | 2 | Bollinger Bands StdDev |
| v_input_float_1 | 3 | Stop Loss (%) |
| v_input_float_2 | 8 | Take Profit (%) |
Source (PineScript)
/*backtest
start: 2024-01-23 00:00:00
end: 2024-02-22 00:00:00
period: 1h
basePeriod: 15m
exchanges: [{"eid":"Futures_Binance","currency":"BTC_USDT"}]
*/

//@version=5
strategy("RSI slowma Ismael", overlay=false, default_qty_type=strategy.percent_of_equity, default_qty_value=100)

// Definir la longitud del RSI
rsi_length = input(title='RSI Length', defval=14)

//media
Fast = input(title='Fast', defval=7)
slow = input(title='Slow', defval=2)

// Definir los niveles de sobrecompra y sobreventa del RSI
rsi_overbought = input(title='RSI Overbought Level', defval=72)
rsi_oversold = input(title='RSI Oversold Level', defval=29)

// Definir la longitud y la desviación estándar de las Bandas de Bollinger
bb_length = input(title="Bollinger Bands Length", defval=14)
bb_stddev = input(title="Bollinger Bands StdDev", defval=2)

// Calcular RSI
rsi_value = ta.rsi(close, rsi_length)

// Calcular Bandas de Bollinger
bb_upper = ta.sma(rsi_value, bb_length) + bb_stddev* ta.stdev(rsi_value, bb_length)
bb_lower = ta.sma(rsi_value, bb_length) - bb_stddev * ta.stdev(rsi_value, bb_length)

//media movil adelantada
fastMA = ta.sma(rsi_value, Fast)
slowMA = ta.sma(rsi_value, slow)

// Definir la señal de compra y venta
buy_signal = (ta.crossover(rsi_value, slowMA) and rsi_value < bb_lower and rsi_value < rsi_oversold) or (rsi_value < bb_lower and rsi_value < rsi_oversold)
sell_signal = (ta.crossunder(rsi_value, slowMA) and rsi_value > bb_upper and rsi_value > rsi_overbought) or (rsi_value > bb_upper and rsi_value > rsi_overbought)

// Configurar las condiciones de entrada y salida del mercado
if buy_signal
    strategy.entry("Buy", strategy.long)

if sell_signal
    strategy.close("Buy")

// Configurar el stop loss y el take profit
stop_loss = input.float(title='Stop Loss (%)', step=0.01, defval=3)
take_profit = input.float(title='Take Profit (%)', step=0.01, defval=8)

strategy.exit("Exit Long", "Buy", stop=close - close * stop_loss / 100, limit=close + close * take_profit / 100)

// Configurar la visualización del gráfico
plot(slowMA, title='RSISMA', color=color.rgb(75, 243, 33), linewidth=1)
plot(fastMA, title='RSIFMA', color=color.rgb(75, 243, 33), linewidth=1)
plot(rsi_value, title='RSI', color=color.purple, linewidth=1)

// Marcar las zonas de sobrecompra y sobreventa en el grafico del RSI
hl= hline(rsi_overbought, title='Overbought', color=color.purple, linestyle=hline.style_dotted, linewidth=1)
hll= hline(rsi_oversold, title='Oversold', color=color.purple, linestyle=hline.style_dotted, linewidth=1)
fill(hl,hll, color= color.new(color.purple, 91))

bbfill = plot(bb_upper, title='Bollinger Bands up', color=color.blue, linewidth=1)
bbfill1= plot(bb_lower, title='Bollinger Bands down', color=color.blue, linewidth=1)
fill(bbfill,bbfill1, color= color.new(#2bb5ec, 91))
Detail
https://www.fmz.com/strategy/442637
Last Modified
2024-02-23 14:07:43
