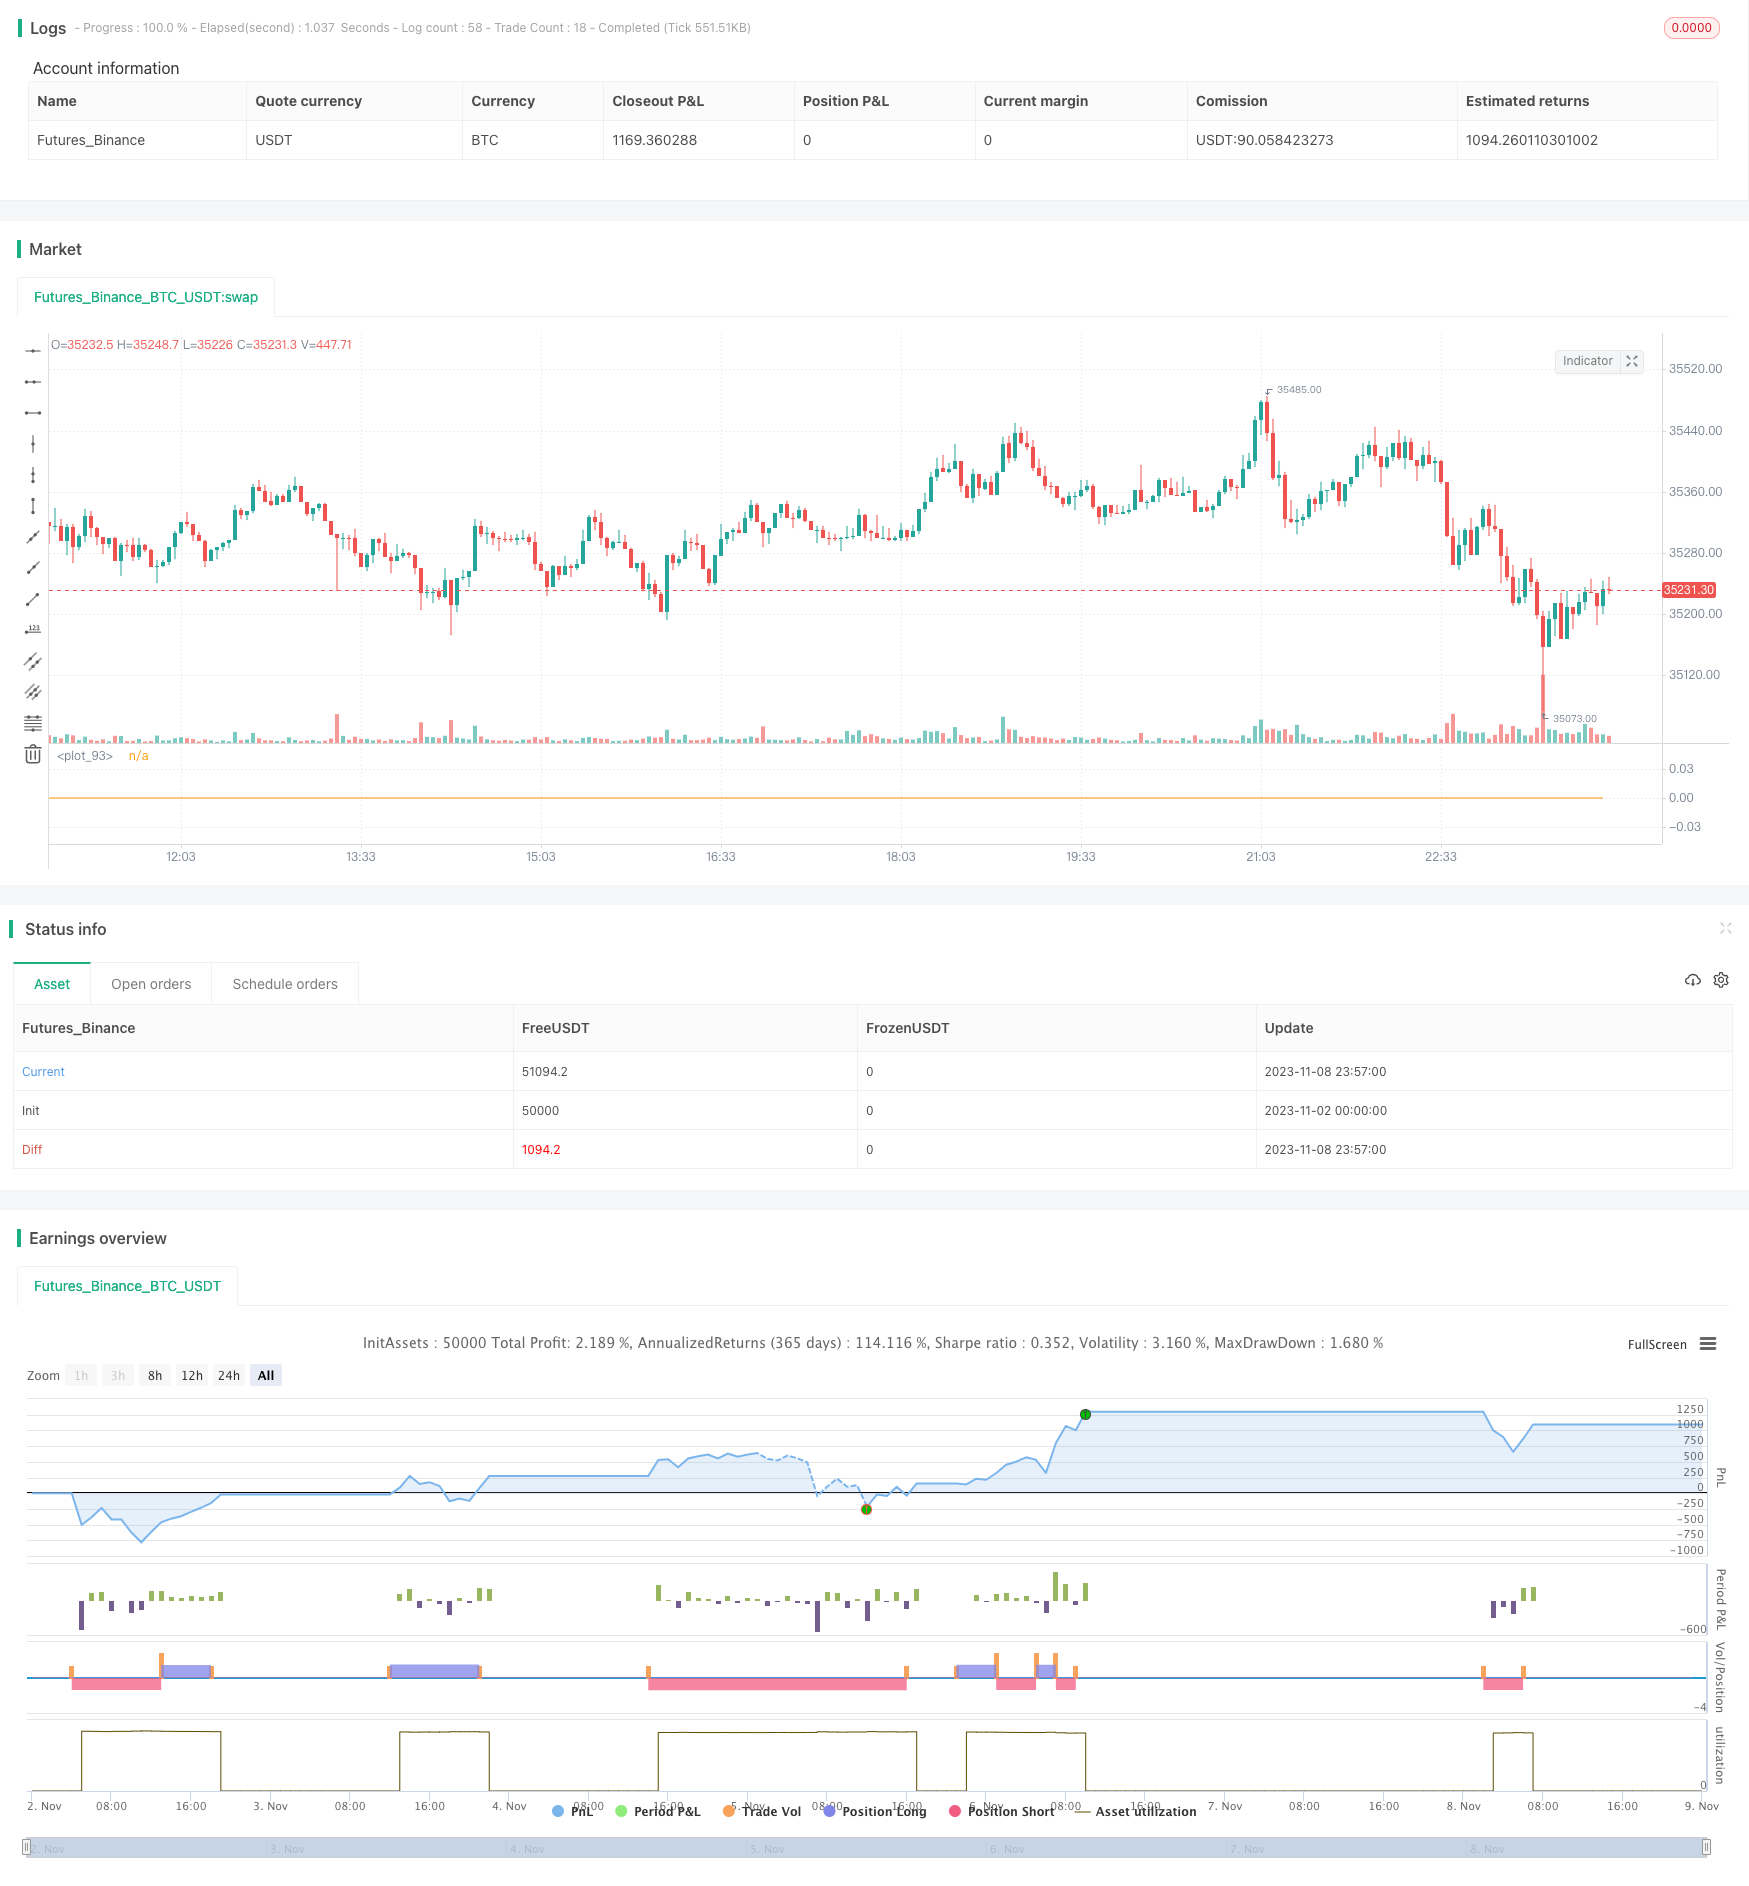
Name
RSI策略的回测与优化Backtesting-and-Optimization-of-RSI-Strategy
Author
ChaoZhang
Strategy Description
本策略基于相对强弱指数(RSI)指标进行超买超卖的判断,在RSI达到超买超卖区域时建立反向头寸,实现低买高卖的目的。策略简单高效,通过捕捉市场短期的超买超卖现象来获取利润。
该策略仅使用RSI指标作为建仓信号。当RSI下穿设定的低点(默认20)时做多,当RSI上穿设定的高点(默认80)时做空。每次交易固定资金(默认100美元),无论行情如何只追求获利1%后止盈。如果亏损达到3%则止损。为控制交易频率,策略还设置了在亏损后会暂停24根K线不进行交易。
具体来说,策略的核心逻辑是:
- 使用RSI指标判断超买超卖
- RSI下穿20时做多
- RSI上穿80时做空
- 每次开仓100美元
- 止盈或止损后平仓
- 若亏损则在下一根K线暂停24根K线不交易
可见该策略非常简单 mechanical,几乎不存在参数优化的空间。它纯粹利用RSI指标的数学特征,在超买超卖区域反向建仓获得反转利润。
该策略最大的优势在于简单和高效。
- 使用单一指标RSI,无需复杂技术分析。
- 完全的机械交易系统,不受个人情绪影响。
- 利用市场短期偏离的数学特征获利,不需要预测市场走势。
- 资金管理规范,止盈止损机制控制风险。
此外,策略还设置了止盈止损比例以锁定利润和控制风险,以及暂停交易机制来降低交易频率。这使得策略以最小的风险获得稳定利润。
该策略的主要风险来自:
-
趋势行情下无法获利。当趋势非常强劲时,RSI可能长期处于超买或超卖区域,反转机会不多,该策略将难以获利。
-
止损设置过大可能导致亏损扩大。目前止损为3%,可能需要调整至1-2%更为合理。
-
交易频率过高容易获利后继续建仓,应适当控制开仓频率。
-
固定每次开仓资金100美元可能风险过度集中,需要优化为资金百分比。
根据上述分析,该策略可以从以下几个方面进行优化:
-
增加趋势判断指标,如MA,在趋势不明朗时暂停交易。
-
优化止损止盈比例,将止损调整为1-2%更合理,止盈可以设置为浮动止盈。
-
增加开仓频率限制,如一定时间内只允许开仓1-2次。
-
将固定资金100美元修改为资金百分比,如1%。
-
优化参数组合,如RSI周期、超买超卖区域等参数的组合优化。
-
增加仓位控制, initial capital增加时不提高单笔交易资金。
通过以上几点优化,可以有效降低交易风险,提高策略稳定性和可靠性。
本策略总体来说非常简单直接,通过RSI指标判断超买超卖获得短期反转利润。优点是简单高效,无需预测,交易逻辑清晰,容易回测和验证。但可能难以对付趋势行情,存在一定亏损风险。通过引入趋势判断、优化参数设置、控制仓位等方法可以进一步增强策略的稳定性和盈利能力。该策略思路新颖,具有实际交易价值,如果合理应用可以获得较好效果。
||
This strategy is based on RSI (Relative Strength Index) indicator to determine overbought and oversold conditions. It takes counter trend positions when RSI reaches overbought or oversold levels to buy low and sell high. The strategy is simple and effective, profiting from short-term overbought and oversold scenarios in the market.
The strategy uses RSI indicator solely as the entry signal. It goes long when RSI crosses below the low point (default 20), and goes short when RSI crosses above the high point (default 80). It trades fixed amount each time (default $100) and aims for 1% profit regardless of market condition. If loss reaches 3%, it stops out. To control trade frequency, strategy stops trading for 24 bars after a losing trade.
The core logic is:
- Use RSI to determine overbought/oversold
- Go long when RSI crosses below 20
- Go short when RSI crosses above 80
- Trade fixed $100 each time
- Take profit or stop loss to close
- If loss, pause trading for 24 bars
As we can see, the strategy is very simple and mechanical. There is barely any space for parameter optimization. It purely exploits the mathematical properties of RSI to take counter trend positions around overbought/oversold regions.
The biggest advantage of this strategy is simplicity and efficiency.
- Uses single indicator RSI, no complex technical analysis needed.
- Fully mechanical system, free from emotional interference.
- Profits from short-term deviation without predicting market direction.
- Risk managed with stop loss/take profit.
It also implements stop loss/take profit ratios to lock in profits and control risks, as well as trade suspension to reduce frequency. This maximizes reward while minimizing risks.
Main risks of this strategy come from:
-
Unable to profit in strong trending market. RSI may stay in overbought/oversold zone for extended period when trend persists.
-
Stop loss too wide may lead to excessive loss. Current 3% stop loss may need to be reduced to 1-2%.
-
High trade frequency may lead to over-trading after wins. Need to limit trade frequency.
-
Fixed $100 size risks concentration. Should optimize to % of capital.
Based on the analysis, the strategy can be improved in the following ways:
-
Add trend filter like MA to pause trading when trend is unclear.
-
Optimize stop loss/take profit ratios. Reduce stop loss to 1-2% and use dynamic take profit.
-
Limit trade frequency, such as max 2 trades per time period.
-
Size trades based on % of capital instead of fixed $100.
-
Optimize RSI parameters like period, overbought/sold levels.
-
Add position sizing to not increase size when capital increases.
With these optimizations, the risks can be reduced and stability improved significantly.
In summary, this is a simple and straightforward strategy using RSI to trade overbought/oversold conditions for short-term mean reversion. The pros are simplicity, efficiency, no prediction needed, clear logic, easy to test. The cons are inability to profit in strong trends and potential losses. With additions like trend filter, optimized parameters, position sizing etc., it can be further enhanced for stability and profitability. The logic is innovative and valuable for practical trading if applied properly.
[/trans]
Strategy Arguments
| Argument | Default | Description |
|---|---|---|
| v_input_int_1 | 50000 | 每次开单资金(usdt) |
| v_input_int_2 | 14 | rsi周期 |
| v_input_float_1 | 20 | RSI触发线 |
| v_input_float_2 | 70 | 顶部rsi止损线 |
| v_input_float_3 | 30 | 底部rsi止损线 |
| v_input_float_4 | 0.03 | 止损线 |
| v_input_float_5 | 0.01 | 止盈 |
| v_input_int_3 | 24 | 亏损后x根K线不做交易 |
Source (PineScript)
/*backtest
start: 2023-11-02 00:00:00
end: 2023-11-09 00:00:00
period: 3m
basePeriod: 1m
exchanges: [{"eid":"Futures_Binance","currency":"BTC_USDT"}]
*/

//@version=5
strategy("rsi超买超卖_回测用", overlay=false, initial_capital=50000, currency=currency.USD, default_qty_type=strategy.cash)
open_pos = input.int(50000, title = "每次开单资金(usdt)")
rsi_period = input.int(14, title = "rsi周期")
rsi_line      = input.float(20.0,      title='RSI触发线',      step=0.05)
stop_rsi_top_line = input.float(70, title = "顶部rsi止损线")
stop_rsi_bottom_line = input.float(30, title = "底部rsi止损线")
stop_loss_perc = input.float(0.03, title = "止损线")
stop_profit = input.float(0.01, title = "止盈")
loss_stop_trade_k = input.int(24, title = "亏损后x根K线不做交易")


rsiParam = ta.rsi(close, rsi_period)

var int failedTimes = 0
var bool stopTrade = false

// plot(rsiParam)

if stopTrade
    failedTimes += 1
    if failedTimes == loss_stop_trade_k
        failedTimes := 0
        stopTrade := false


// 获取当前持仓方向
checkCurrentPosition() =>
    strategy.position_size > 0 ? 1 : strategy.position_size < 0 ? -1 : 0

curPosition = checkCurrentPosition()

// 当前持仓成本价
position_avg_price = strategy.position_avg_price


// 当前持单, 触达反向的rsi线,清仓
if curPosition > 0 and rsiParam >= stop_rsi_top_line
    strategy.close_all(comment = "closebuy")

if curPosition < 0 and rsiParam <= stop_rsi_bottom_line
    strategy.close_all(comment = "closesell")


// 止盈止损清仓
if curPosition > 0
    // if (position_avg_price - close) / close >= stop_loss_perc
    //     // 止损
    //     strategy.close_all(comment = "closebuy")
    //     stopTrade := true
    if (close - position_avg_price) / position_avg_price >= stop_profit
        // 止盈
        strategy.close_all(comment = "closebuy")


if curPosition < 0
    // if (close - position_avg_price) / position_avg_price >= stop_loss_perc
    //     // 止损
    //     strategy.close_all(comment = "closesell")
    //     stopTrade := true

    if (position_avg_price - close) / close >= stop_profit
        // 止盈
        strategy.close_all(comment = "closesell")


a = strategy.closedtrades.exit_bar_index(strategy.closedtrades - 1)

if bar_index == a and strategy.closedtrades.profit(strategy.closedtrades - 1) < 0
    stopTrade := true

var float openPrice = 0.0


if rsiParam <= rsi_line and stopTrade == false
	strategy.entry("long", strategy.long, open_pos / close, comment = "long")
    if curPosition == 0
        openPrice := close
    strategy.exit("long_stop", "long", limit = openPrice * (1+stop_profit), stop=openPrice * (1-stop_loss_perc), comment = "closebuy")

if rsiParam >= 100 - rsi_line and stopTrade == false
    strategy.entry("short", strategy.short, open_pos / close, comment = "short")
    if curPosition == 0
        openPrice := close
    strategy.exit("short_stop", "short", limit = openPrice * (1-stop_profit), stop=openPrice * (1+stop_loss_perc), comment = "closesell")


plot(failedTimes)
Detail
https://www.fmz.com/strategy/431668
Last Modified
2023-11-10 11:59:40
