Name
RSI菲波那契回调策略RSI-Fibonacci-Retracement-Strategy
Author
ChaoZhang
Strategy Description
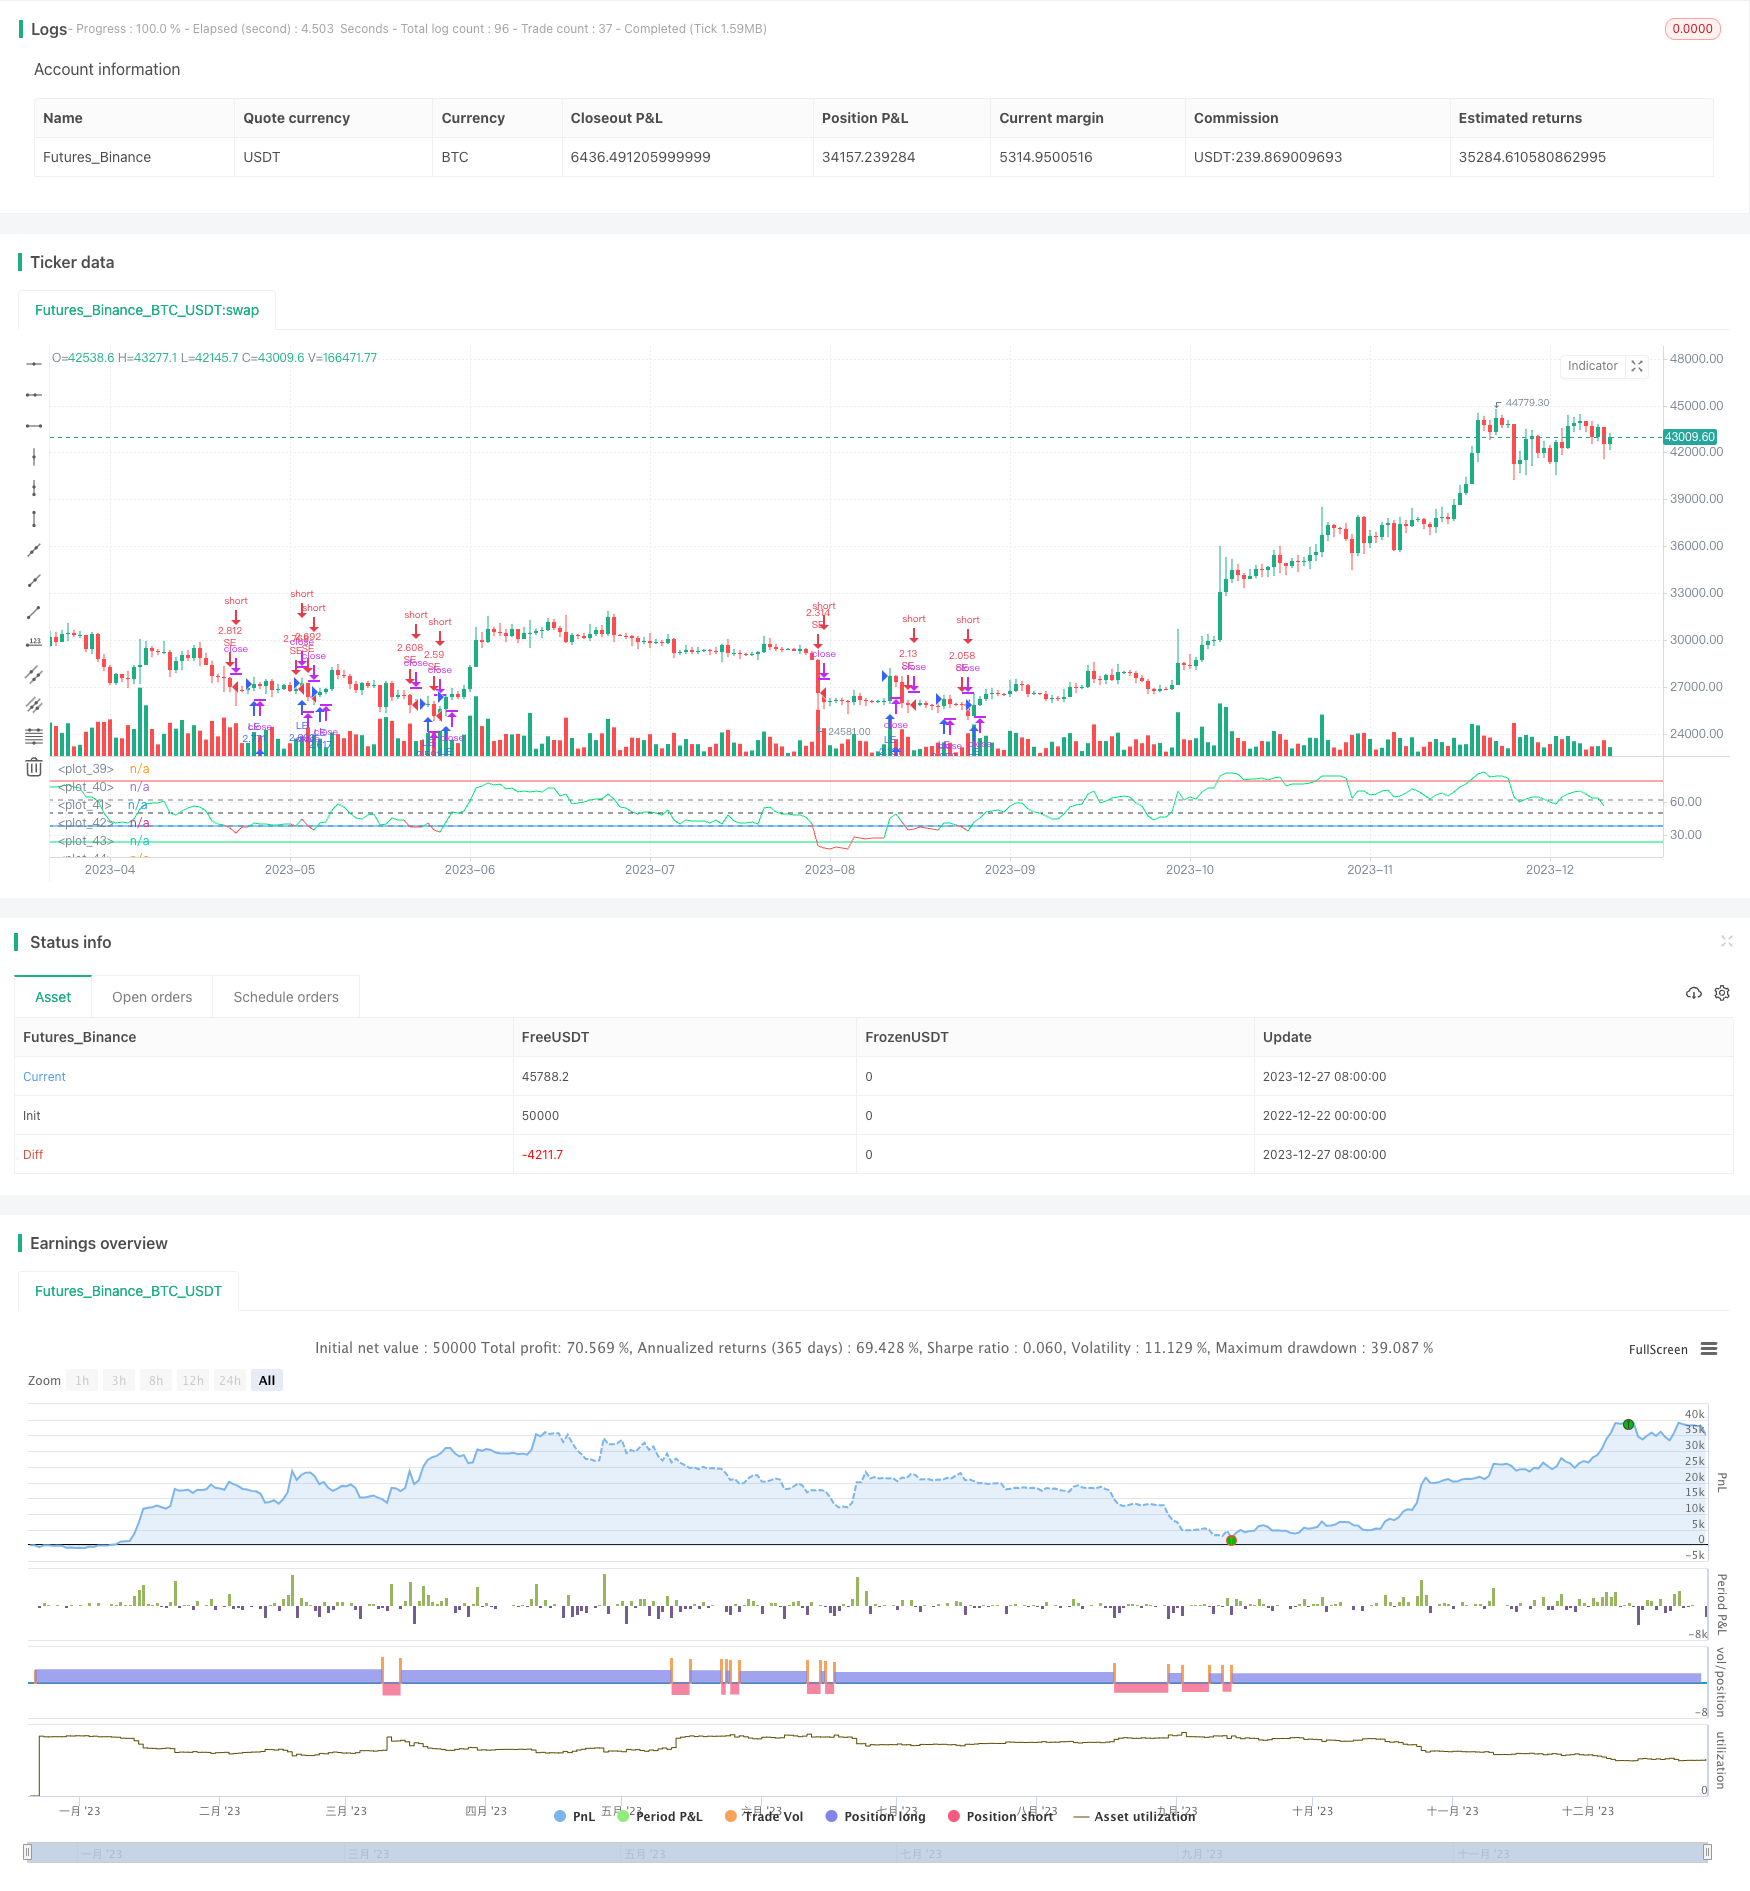
RSI菲波那契回调策略通过计算RSI指标与设置的菲波那契回调级别的交叉作为交易信号,在超买超卖区域发生反转时入场,属于趋势跟踪策略。
该策略基于RSI指标与菲波那契回调级别的交叉实现。首先计算RSI指标的值,然后设置菲波那契回调级别(38.2%、50%、61.8%),当RSI指标上穿菲波那契级别时生成买入信号,下穿时生成卖出信号。
RSI指标用于判断市场是超买还是超卖。RSI大于70时为超买区,小于30时为超卖区。当RSI从超买区下降到菲波那契回调区时,属于反转信号,做多;当RSI从超卖区上升到菲波那契回调区时,属于反转信号,做空。
菲波那契回调区在本策略中主要作为参考,与RSI形成交易信号。趋势市场中,回调后的继续运行常常会触碰菲波那契回调级别,这些级别相当于支持阻力。与RSI交叉做为交易信号,可以捕捉反转机会。
-
使用RSI判断超买超卖形态,配合菲波那契回调区捕捉反转机会,可以过滤部分噪音。
-
趋势跟踪性质,可捕捉中长线趋势。
-
可以通过调整菲波那契回调区来适应不同市场情况。
-
多空头寸持有时间可能较长,需要有足够的资金支持。
-
回调过程中可能出现再次探高探底现象,需要设置止损来控制风险。
-
参数设置不当可能导致交易频繁或捕捉不到足够反转机会。
-
可以考虑结合其他指标过滤入场时机。例如MACD、布林带等指标判断趋势方向。
-
可以优化RSI参数以及菲波那契回调区设置。
-
可以设置动态止损来锁定利润。
RSI菲波那契回调策略整体作为一个趋势跟踪策略,具有很好的稳定性。相比单一RSI策略,加入菲波那契回调区可以有效过滤部分噪声交易。通过参数优化可以适应不同市场的交易品种。总体来说是一个可靠、易于优化的策略思路。
||
The RSI Fibonacci Retracement strategy generates trading signals based on the crossover between the RSI indicator and the set Fibonacci retracement levels, taking positions when reversals occur in overbought and oversold areas. It belongs to the trend following strategies.
This strategy is implemented based on the crossover between the RSI indicator and the Fibonacci retracement levels. First calculate the value of RSI indicator, then set the Fibonacci retracement levels (38.2%, 50%, 61.8%). When the RSI indicator crosses above the Fibonacci level, a buy signal is generated. When it crosses below, a sell signal is generated.
The RSI indicator is used to judge whether the market is overbought or oversold. RSI above 70 indicates an overbought area and below 30 indicates an oversold area. When RSI drops from the overbought area to the Fibonacci retracement zone, it is a reversal signal to go long. When RSI rises from the oversold area to the Fibonacci retracement zone, it is a reversal signal to go short.
The Fibonacci retracement levels in this strategy mainly serve as a reference, forming trading signals with RSI. In trending markets, continued running after retracements often touches Fibonacci retracement levels, which act like supports and resistances. Taking crossover with RSI as trading signals can capture reversal opportunities.
-
Using RSI to identify overbought and oversold formations, combined with Fibonacci retracement area to capture reversal opportunities, can filter out some noise.
-
Trend following in nature, can capture mid-to-long term trends.
-
Can adapt to different market situations by adjusting the Fibonacci retracement area.
-
Long or short positions may last for a long time, requiring sufficient capital support.
-
Retracement process may exhibit probing highs and lows again, requiring stop loss to control risks.
-
Improper parameter settings may lead to excessive trading or insufficient capturing of reversal opportunities.
-
Consider incorporating other indicators to filter entry timing, such as MACD, Bollinger Bands to judge trend direction.
-
Parameters like RSI periods and Fibonacci retracement levels can be optimized.
-
Set up dynamic stop loss to lock in profits.
The RSI Fibonacci Retracement strategy has good stability in general as a trend following strategy. Compared to single RSI strategies, adding the Fibonacci retracement area can effectively filter out some noisy trades. By parameter optimization it can adapt to different trading instruments across various markets. In conclusion this is a reliable and easy-to-optimize strategy idea.
[/trans]
Strategy Arguments
| Argument | Default | Description |
|---|---|---|
| v_input_1 | 14 | Rsi Periods |
| v_input_2 | 0 | Fibonacci Level: 38.2 |
| v_input_3 | 2010 | From Year |
| v_input_4 | true | From Month |
| v_input_5 | 2020 | To Year |
| v_input_6 | true | To Month |
Source (PineScript)
/*backtest
start: 2022-12-22 00:00:00
end: 2023-12-28 00:00:00
period: 1d
basePeriod: 1h
exchanges: [{"eid":"Futures_Binance","currency":"BTC_USDT"}]
*/

// (c) ReduX_o, 2019. All rights reserved.
//
// How to trade:
// The indicator is more reliable in longer time frames
// Choose a fibonacci level as reference
// Buy when the RSI line turns green
// Sell when the RSI line turns red


//@version=4
strategy("RSI Fibonacci Levels", overlay=false, initial_capital=2000, currency=currency.USD, commission_value=0.1, slippage=0, commission_type=strategy.commission.percent, pyramiding=0, default_qty_type=strategy.percent_of_equity, default_qty_value=100)


len = input(14, minval=1, title="Rsi Periods")
f1 = input(title="Fibonacci Level", defval="38.2", options=["38.2", "50", "61.8"])

// === BACKTEST RANGE ===
FromYear = input(defval=2010, title="From Year", minval=2010)
FromMonth = input(defval=1, title="From Month", minval=1)

ToYear = input(defval=2020, title="To Year", minval=2010)
ToMonth = input(defval=1, title="To Month", minval=1)


src = hl2
fi= (f1 == "38.2") ? 38.2 : (f1 == "50")? 50 : 61.8


up = rma(max(change(src), 0), len)
down = rma(-min(change(src), 0), len)
rsi = down == 0 ? 100 : up == 0 ? 0 : 100 - 100 / (1 + up / down)


//***************************************************
rcolor = rsi >= fi ? color.lime : color.red

plot(rsi, title="RSI", color=rcolor, transp=0)
band1 = hline(78.6, color=color.red, linestyle= hline.style_solid,  editable= false)
band0 = hline(23.6, color=color.lime, linestyle= hline.style_solid, editable= false)
band2 = hline(61.8, color=color.gray, editable= false)
band3 = hline(50, color=color.black, editable= false)
band4 = hline(38.2, color=color.gray, editable= false)
band5 = hline(fi, color=color.blue, linestyle= hline.style_solid, editable= false)

strategy.entry("LE", strategy.long, comment="L", when=rsi >= fi )
strategy.entry("SE", strategy.short, comment="S", when=rsi < fi )
Detail
https://www.fmz.com/strategy/437010
Last Modified
2023-12-29 14:51:43
