Name
RSI-Buy-Sell-Signals
Author
ChaoZhang
Strategy Description
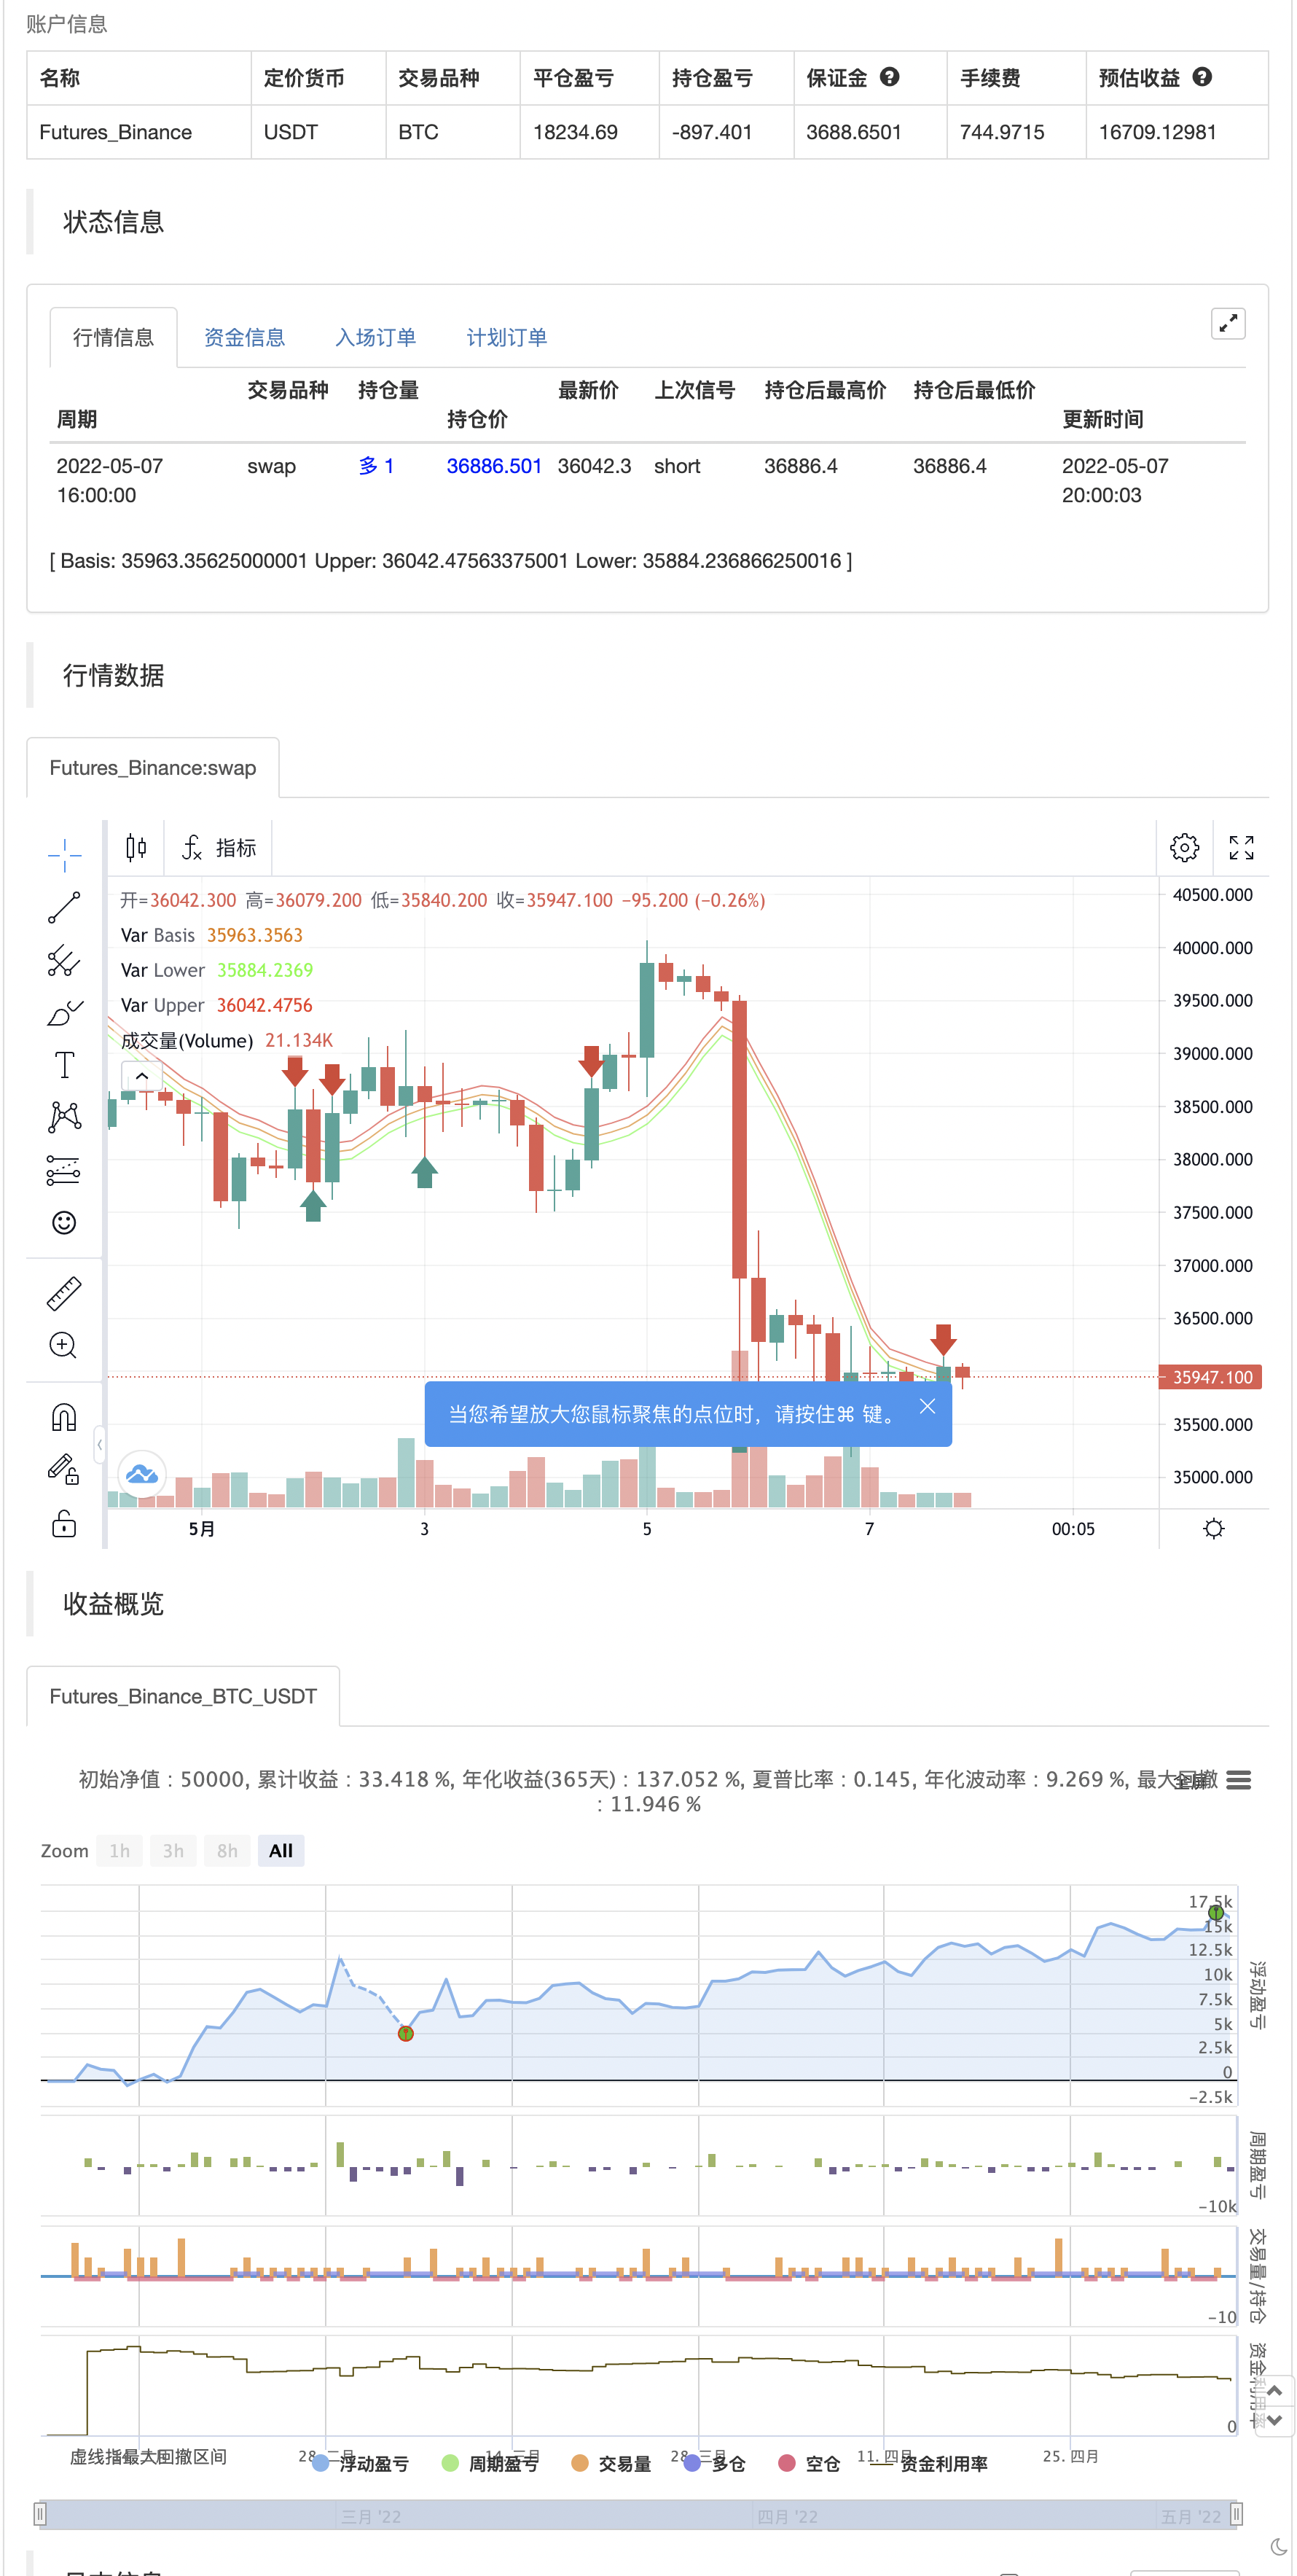
This indicator is mainly based on Overbought and Oversold. Indicator for short-term trading. This way you can get small but acceptable signals. The main basis of the indicator is as follows: To buy, the indicator is waiting for the instrument to be oversold from the RSI point of view. Then, if the chart crosses the bottom line of the Envelope indicator from the bottom to the top, a buy signal is issued. For sell, the indicator waits for the instrument to be overbought from the RSI perspective. Then, if the chart crosses the top line of the Envelope indicator from top to bottom, a sell signal is issued. The general basis is the consonance of the price and the RSI indicator. The best settings I came up with myself: Time frame: 15 minutes Overbought: 80 Oversell: 25 RSI Length: 8 It can be done on different instruments. But always set your profit and loss limits. (Profit to loss ratio in this indicator can be 1: 1.)
Disclaimer: This information and trading indicators and tools provided neither is, nor should be construed, as an offer, or a solicitation of an offer, to buy or sell securities. You shall be fully responsible for any investment decision you make, and such decisions will be based solely on your evaluation of your financial circumstances, investment objectives, risk tolerance, and liquidity needs. I am not liable for any profit, financial improvement, losses or damages, monetary or other that may result from the application of information contained within this indicator. Individual traders must use their own due diligence in analyzing featured trading indicators, other trading tools, webinars and other educational materials to determine if they represent suitable and useable features and capabilities for the individual trader.
backtest
Strategy Arguments
| Argument | Default | Description |
|---|---|---|
| v_input_3 | false | exponential |
| v_input_int_1 | 8 | (?Envelope Settings)Envelope Length |
| v_input_1 | 0.22 | Envelope Percent |
| v_input_2_hl2 | 0 | Envelope Source: hl2 |
| v_input_int_2 | 8 | (?RSI Settings)RSI Length |
| v_input_source_1_hl2 | 0 | RSI Source: hl2 |
| v_input_4 | 80 | RSI OverBought Limit(Recommended: 70-85) |
| v_input_5 | 25 | RSI OverSold Limit(Recommended: 20-30) |
Source (PineScript)
/*backtest
start: 2022-02-08 00:00:00
end: 2022-05-08 00:00:00
period: 4h
basePeriod: 15m
exchanges: [{"eid":"Futures_Binance","currency":"BTC_USDT"}]
*/

// This source code is subject to the terms of the Mozilla Public License 2.0 at https://mozilla.org/MPL/2.0/
// © Saleh_Toodarvari

//@version=5
indicator(title="ENVELOPE - RSI - Buy Sell Signals", shorttitle="ENVELOPE - RSI", overlay=true)
//_________________Envelope_________________
len = input.int(8, title="Envelope Length", minval=1, group="Envelope Settings")
percent = input(0.22,title="Envelope Percent", group="Envelope Settings")
src = input(hl2, title="Envelope Source", group="Envelope Settings")
exponential = input(false)
basis = exponential ? ta.ema(src, len) : ta.sma(src, len)
k = percent/100.0
upper = basis * (1 + k)
lower = basis * (1 - k)
plot(basis, "Basis", color=#ED7300)
u = plot(upper, "Upper", color=#FF2424)
l = plot(lower, "Lower", color=#24FF24)
//fill(u, l, color=color.rgb(33, 150, 243, 95), title="Background")
cross_buy=ta.crossover(close,lower)
cross_sell=ta.crossunder(close,upper)
// _________________RSI_________________
rsiLengthInput = input.int(8, minval=1, title="RSI Length", group="RSI Settings")
rsiSourceInput = input.source(hl2, "RSI Source", group="RSI Settings")
up = ta.rma(math.max(ta.change(rsiSourceInput), 0), rsiLengthInput)
down = ta.rma(-math.min(ta.change(rsiSourceInput), 0), rsiLengthInput)
rsi = down == 0 ? 100 : up == 0 ? 0 : 100 - (100 / (1 + up / down))
Overbought_RSI = input(title="RSI OverBought Limit(Recommended: 70-85)", defval=80, group="RSI Settings")
Oversold_RSI = input(title="RSI OverSold Limit(Recommended: 20-30)", defval=25, group="RSI Settings")
condition_buy= rsi<Oversold_RSI and (ta.cross(low,lower) or ta.cross(close,lower) or ta.cross(high,lower) or ta.cross(open,lower))
condition_sell= rsi>Overbought_RSI and (ta.cross(low,upper) or ta.cross(close,upper) or ta.cross(high,upper) or ta.cross(open,upper))
if cross_sell
    strategy.entry("Enter Long", strategy.long)
else if cross_buy
    strategy.entry("Enter Short", strategy.short)

// plotshape(cross_sell ? condition_sell:na, title="Sell Label", text="Sell", location=location.abovebar, style=shape.labeldown, size=size.tiny, color=color.red, textcolor=color.white)
// sell_sig=plot(cross_sell ? high:na,color=color.new(#000000,100))
// plotshape(cross_buy ? condition_buy:na, title="Buy Label", text="Buy", location=location.belowbar, style=shape.labelup, size=size.tiny, color=color.green, textcolor=color.white)
// buy_sig=plot(cross_buy ? ohlc4:na,color=color.new(#000000,100))
// tpColor = if(cross_sell[1] or cross_sell[2] or cross_buy[1] or cross_buy[2])
//     color.new(#1DBC60, 30)
// else
//     color.new(#000000,100)
// slColor = if(cross_sell[1] or cross_sell[2] or cross_buy[1] or cross_buy[2])
//     color.new(#F74A58, 30)
// else
//     color.new(#000000,100)
// //_________________TP&SL_________________
// TP_Percent = input.float(0.15, "TP %")
// SL_Percent = input.float(0.15, "SL %")
// tp= if condition_sell
//     ohlc4-ohlc4*(TP_Percent/100)
// else if condition_buy
//     ohlc4+ohlc4*(TP_Percent/100)
// sl= if condition_sell
//     ohlc4+ohlc4*(SL_Percent/100)
// else if condition_buy
//     ohlc4-ohlc4*(SL_Percent/100)
// tp_sig=plot(tp,color=color.new(#000000,100),title="tp")
// sl_sig=plot(sl,color=color.new(#000000,100),title="tp")
// lower_plot=plot(lower,color=color.new(#000000,100))
// fill(sell_sig,tp_sig, color=tpColor)
// fill(buy_sig,tp_sig, color=tpColor)
// fill(buy_sig,sl_sig, color=slColor)
// fill(sell_sig,sl_sig, color=slColor)
Detail
https://www.fmz.com/strategy/362004
Last Modified
2022-05-09 15:14:58
