Name
Relative-Strength-Index-Divergences-Libertus
Author
ChaoZhang
Strategy Description
Hello all,
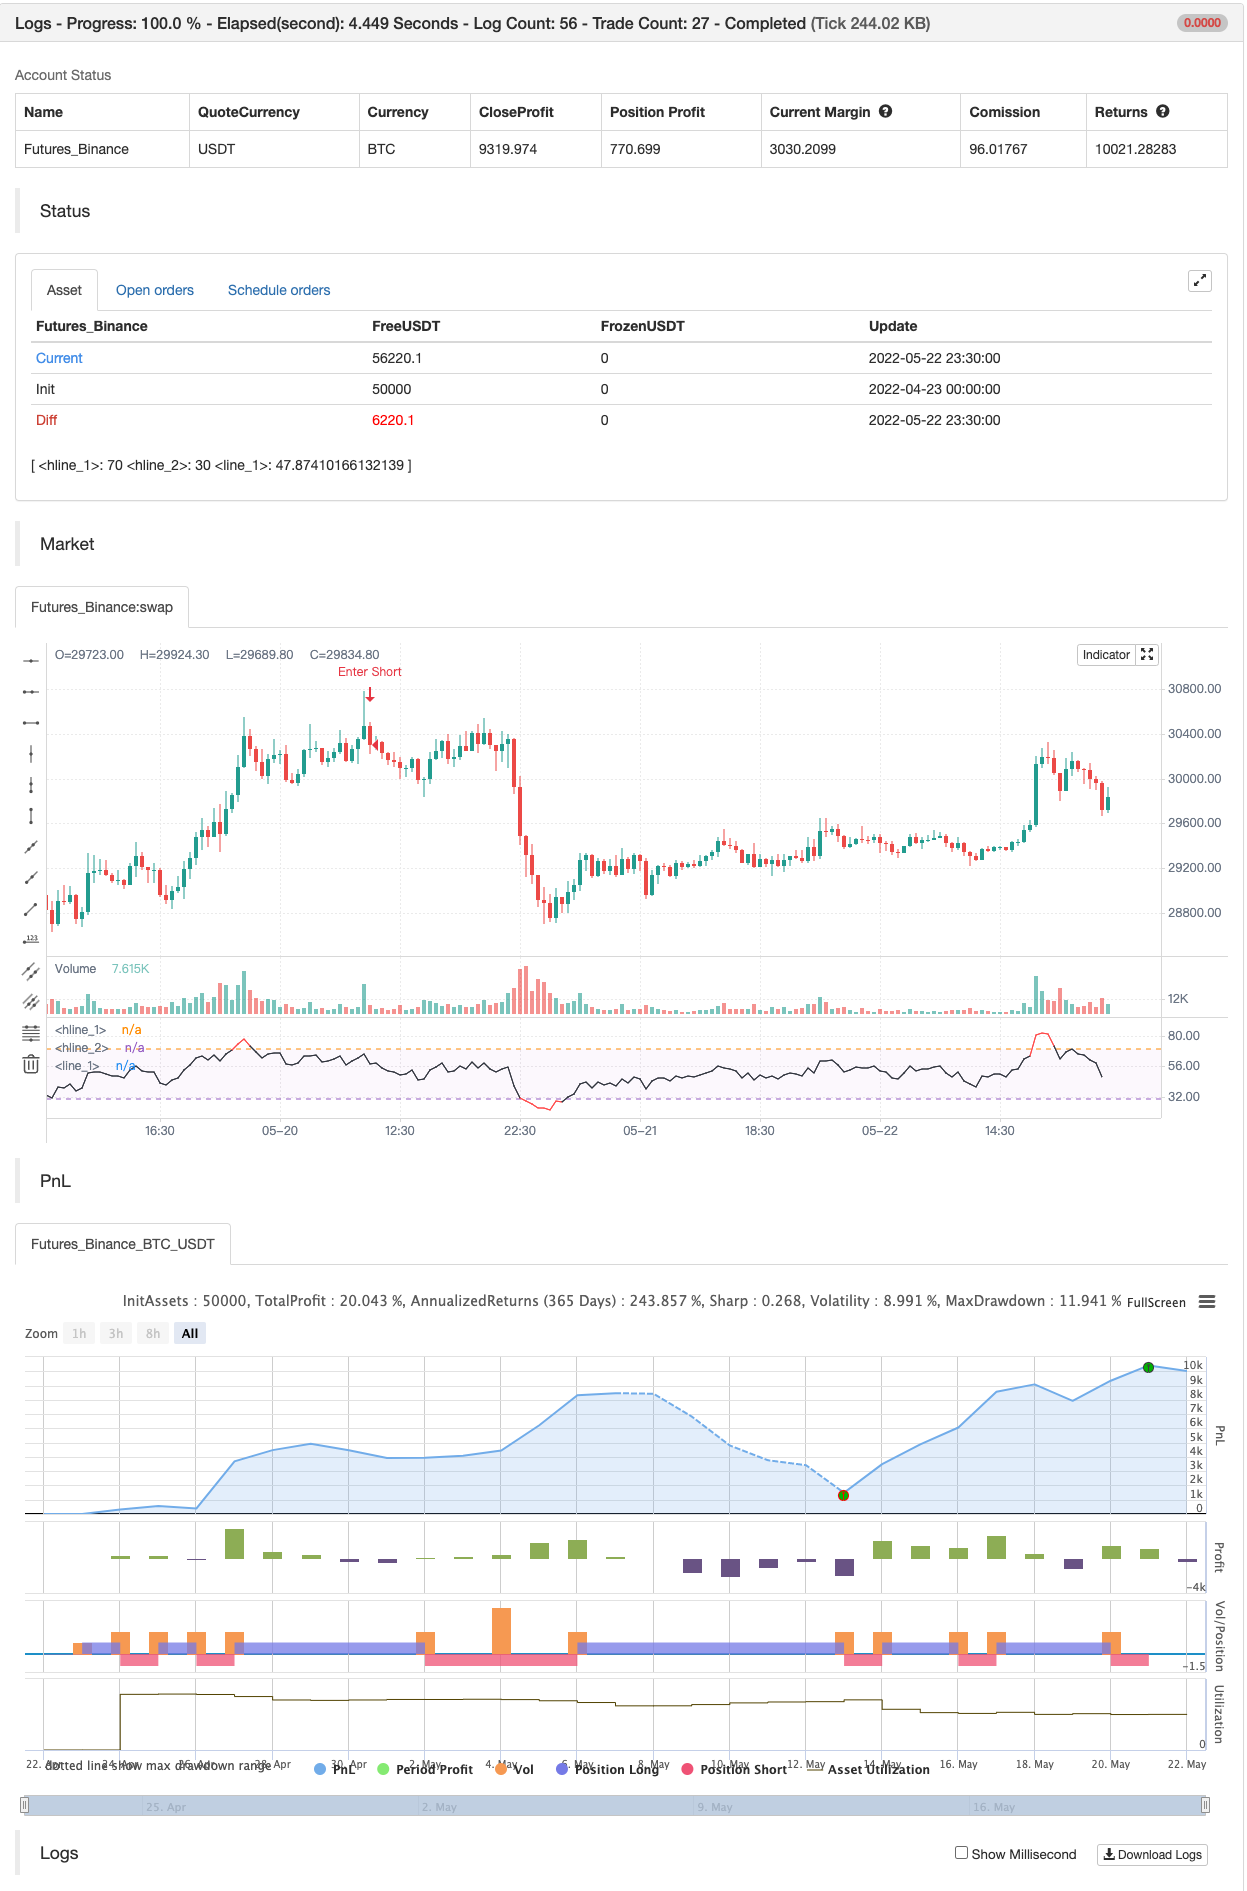
To ease everyone's trading experience I made this script which colors RSI overbought and oversold conditions and as a bonus displays bullish or bearish divergences in last 50 candles (by default, you can change it). Script is open source, part of code is from Trading View examples. If you have suggestions or you already made some improvements, please report in comment.
Happy trading and good luck!
backtest
Strategy Arguments
| Argument | Default | Description |
|---|---|---|
| v_input_1 | 14 | RSI Length |
| v_input_2 | 70 | Overbought |
| v_input_3 | 30 | Oversold |
| v_input_4 | false | Hide pivots? |
| v_input_5 | false | Shorter labels? |
| v_input_6 | false | Hide labels and color background |
| v_input_7 | 90 | Div lookback period (bars)? |
Source (PineScript)
//@version=4
// Copyright by Libertus - 2021
// RSI Divergences v3.2
// Free for private use
study(title="Relative Strength Index - Divergences - Libertus", shorttitle="RSI Div - Lib")
len = input(14, minval=1, title="RSI Length")
ob = input(defval=70, title="Overbought", type=input.integer, minval=0, maxval=100)
os = input(defval=30, title="Oversold", type=input.integer, minval=0, maxval=100)

// RSI code
rsi = rsi(close, len)
band1 = hline(ob)
band0 = hline(os)
plot(rsi, color=(rsi > ob or rsi < os ? color.new(color.red, 0) : color.new(color.black, 0)))
fill(band1, band0, color=color.new(color.purple, 97))

// DIVS code
piv = input(false,"Hide pivots?")
shrt = input(false,"Shorter labels?")
hidel = input(false, "Hide labels and color background")
xbars = input(defval=90, title="Div lookback period (bars)?", type=input.integer, minval=1)
hb = abs(highestbars(rsi, xbars)) // Finds bar with highest value in last X bars
lb = abs(lowestbars(rsi, xbars)) // Finds bar with lowest value in last X bars

// Defining variable values, mandatory in Pine 3
max = float(na)
max_rsi = float(na)
min = float(na)
min_rsi = float(na)
pivoth = bool(na)
pivotl = bool(na)
divbear = bool(na)
divbull = bool(na)

// If bar with lowest / highest is current bar, use it's value
max := hb == 0 ? close : na(max[1]) ? close : max[1]
max_rsi := hb == 0 ? rsi : na(max_rsi[1]) ? rsi : max_rsi[1]
min := lb == 0 ? close : na(min[1]) ? close : min[1]
min_rsi := lb == 0 ? rsi : na(min_rsi[1]) ? rsi : min_rsi[1]

// Compare high of current bar being examined with previous bar's high
// If curr bar high is higher than the max bar high in the lookback window range
if close > max // we have a new high
    max := close // change variable "max" to use current bar's high value
if rsi > max_rsi // we have a new high
    max_rsi := rsi // change variable "max_rsi" to use current bar's RSI value
if close < min // we have a new low
    min := close // change variable "min" to use current bar's low value
if rsi < min_rsi // we have a new low
    min_rsi := rsi // change variable "min_rsi" to use current bar's RSI value

// Finds pivot point with at least 2 right candles with lower value
pivoth := (max_rsi == max_rsi[2]) and (max_rsi[2] != max_rsi[3]) ? true : na
pivotl := (min_rsi == min_rsi[2]) and (min_rsi[2] != min_rsi[3]) ? true : na

// Detects divergences between price and indicator with 1 candle delay so it filters out repeating divergences
if (max[1] > max[2]) and (rsi[1] < max_rsi) and (rsi <= rsi[1])
    divbear := true
if (min[1] < min[2]) and (rsi[1] > min_rsi) and (rsi >= rsi[1])
    divbull := true

// Alerts
alertcondition(divbear, title='Bear div', message='Bear div')
alertcondition(divbull, title='Bull div', message='Bull div')
alertcondition(pivoth, title='Pivot high', message='Pivot high')
alertcondition(pivotl, title='Pivot low', message='Pivot low')

if divbull
    strategy.entry("Enter Long", strategy.long)
else if divbear
    strategy.entry("Enter Short", strategy.short)

// // Plots divergences and pivots with offest
// l = divbear ?
//       label.new (bar_index-1, rsi[1]+1, "BEAR", color=color.red, textcolor=color.white, style=label.style_labeldown, yloc=yloc.price, size=size.small) :
//       divbull ?
//           label.new (bar_index-1, rsi[1]-1, "BULL", color=color.green, textcolor=color.white, style=label.style_labelup, yloc=yloc.price, size=size.small) :
//           pivoth ?
//               label.new (bar_index-2, max_rsi+1, "PIVOT", color=color.blue, textcolor=color.white, style=label.style_labeldown, yloc=yloc.price, size=size.small) :
//               pivotl ?
//                   label.new (bar_index-2, min_rsi-1, "PIVOT", color=color.blue, textcolor=color.white, style=label.style_labelup, yloc=yloc.price, size=size.small) :
//                   na

// // Shorter labels
// if shrt
//     label.set_text (l, na)
// // Hides pivots or labels
// if (piv and (pivoth or pivotl)) or hidel
//     label.delete (l)
// // Colors indicator background
// bgcolor (hidel ? (divbear ? color.new(color.red, 50) : divbull ? color.new(color.green, 50) : na) : na, offset=-1)
// bgcolor (hidel ? (piv ? na : (pivoth or pivotl ? color.new(color.blue, 50) : na)) : na, offset=-2)

// Debug tools
// plot(max, color=blue, linewidth=2)
// plot(max_rsi, color=red, linewidth=2)
// plot(hb, color=orange, linewidth=2)
// plot(lb, color=purple, linewidth=1)
// plot(min_rsi, color=lime, linewidth=1)
// plot(min, color=black, linewidth=1)
Detail
https://www.fmz.com/strategy/365359
Last Modified
2022-05-24 15:25:05
