Name
SAR交替时间框架交易策略SAR-Alternating-Timeframe-Trading-Strategy
Author
ChaoZhang
Strategy Description
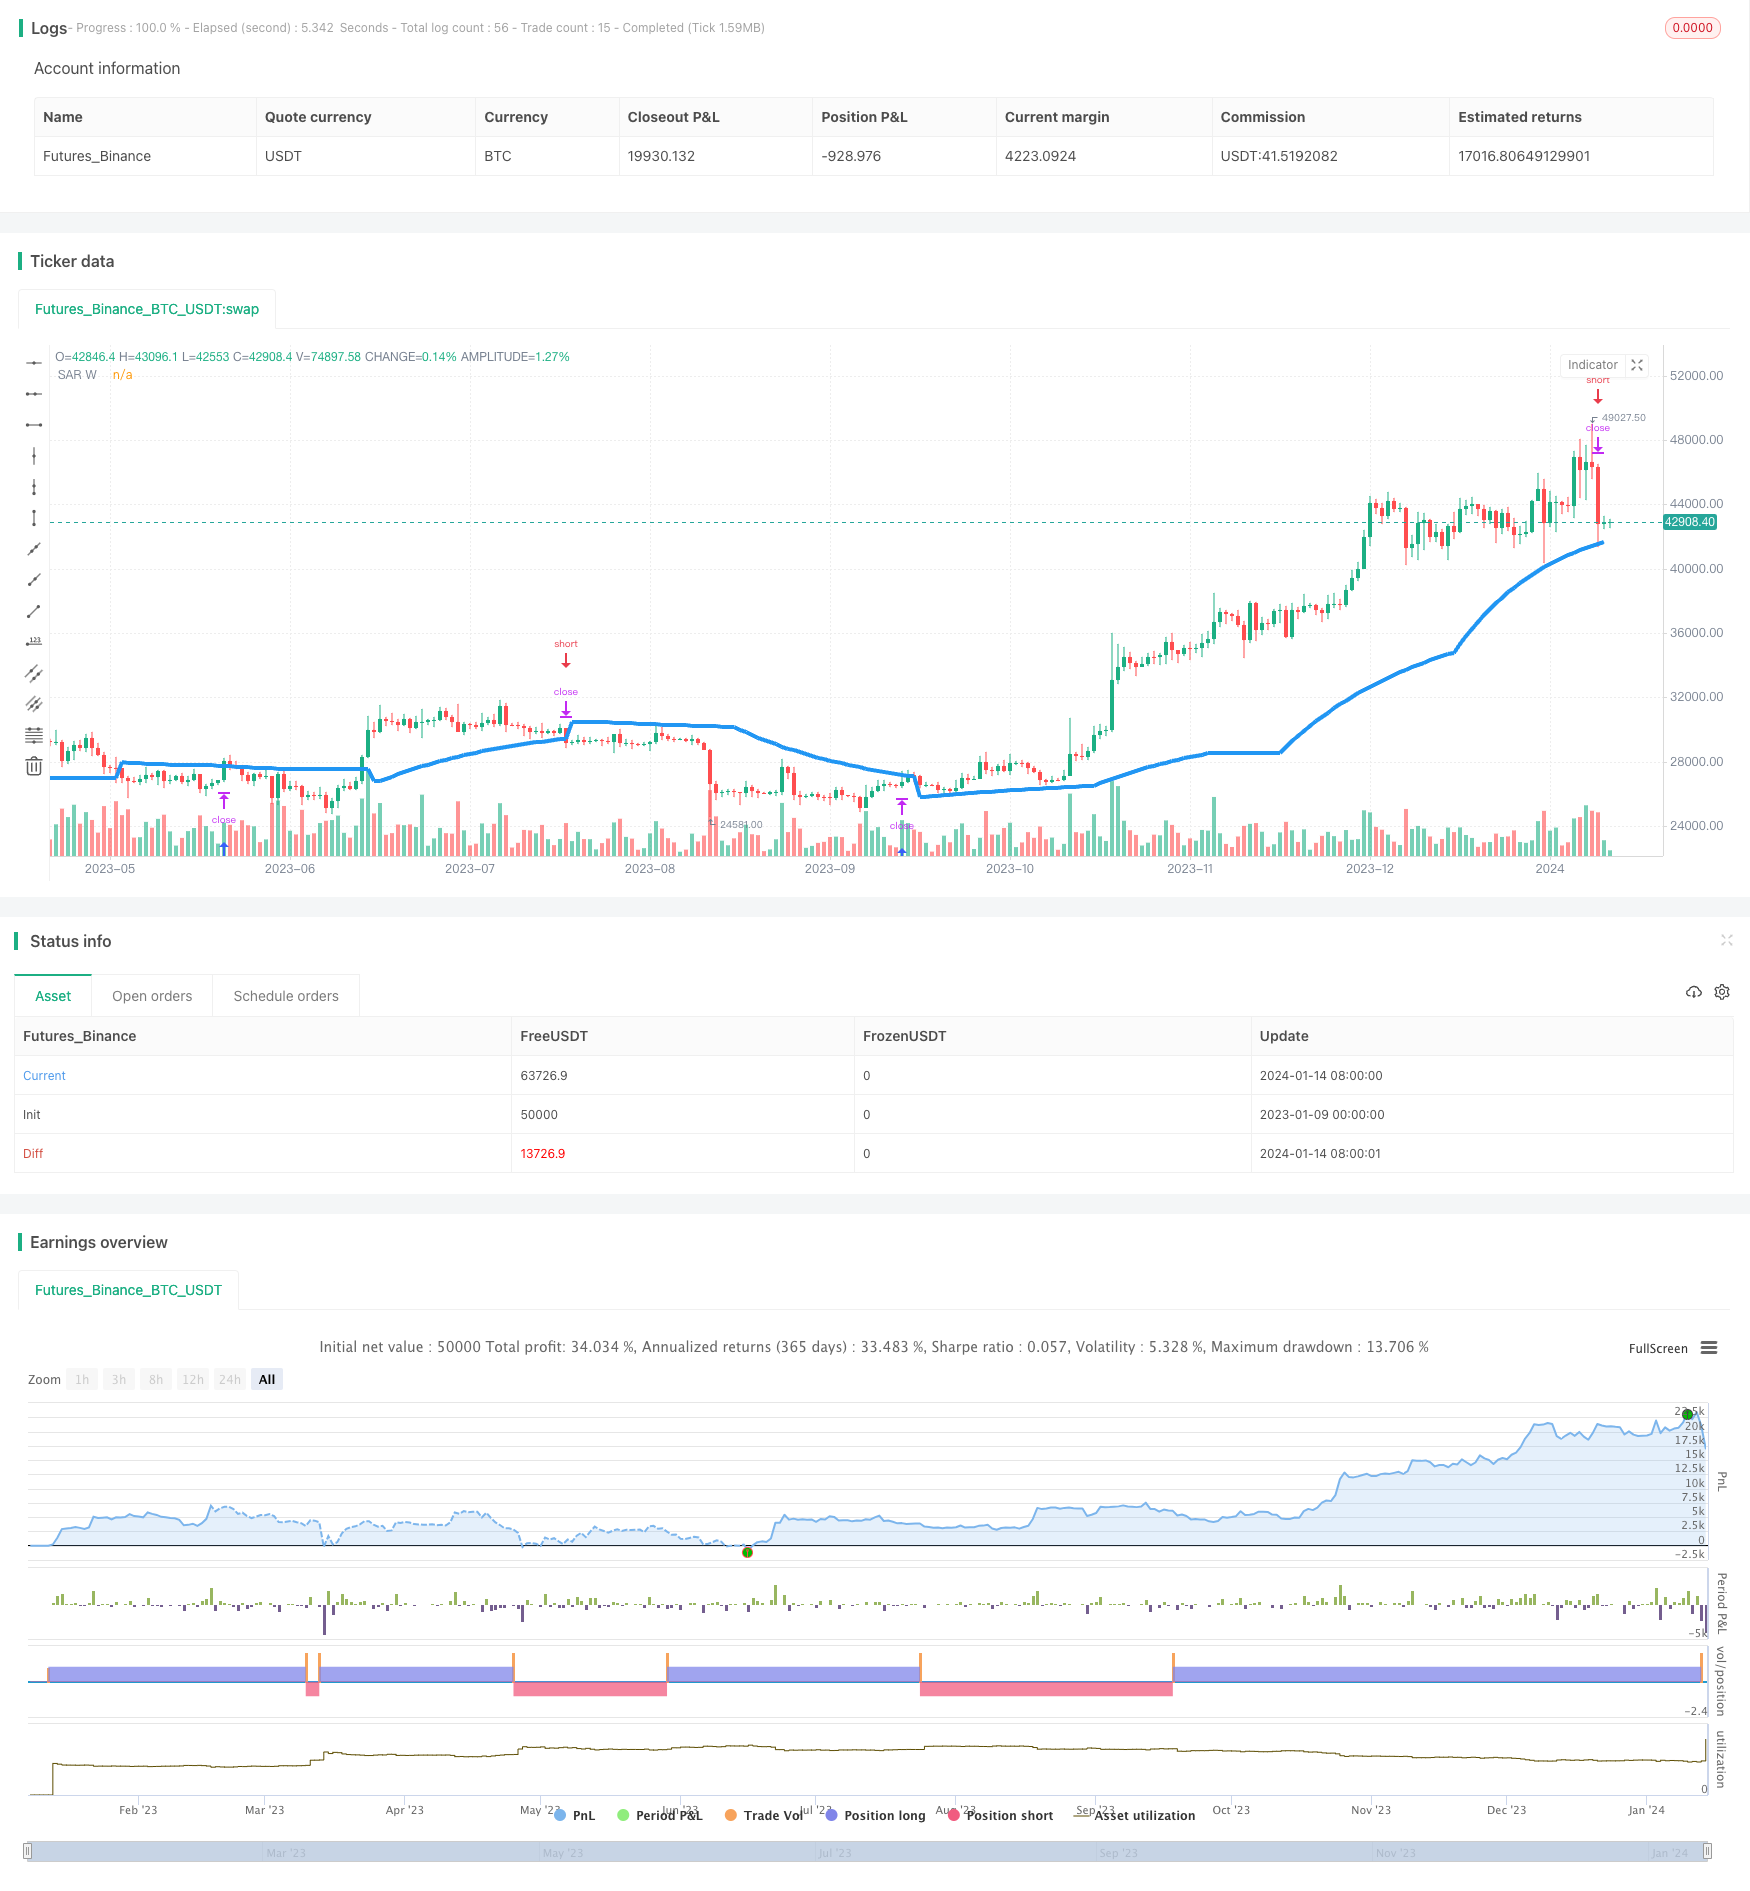
该策略是基于SAR指标在不同时间周期进行交替操作的交易策略。策略会在15分钟,日线,周线和月线时间框架下分别计算SAR指标,并在周线时间框架下进行交易操作。当周线SAR指标上穿最高价时做多,下穿最低价时做空。
SAR指标代表抛物线转向指标(Parabolic SAR),它通过计算当前价格与历史价格的关系来判断市场的趋势方向,当价格突破SAR点时,表示趋势发生反转。
本策略在15分钟,日线,周线和月线时间框架下分别计算SAR值。计算公式为:
SAR = SAR前值 + 加速因子(最高价 - SAR前值) # 多头趋势
SAR = SAR前值 + 加速因子(最低价 - SAR前值) # 空头趋势
其中,加速因子初值设置为0.02,随着趋势的延续会逐步增加至最大0.2。
策略在周线时间框架下发出交易信号。当周线SAR上穿最高价时做多,设置止损为SAR值。当SAR下穿最低价时做空,设置止损为SAR值。
该策略通过在更高级别的时间框架判断趋势,设置更精确的止损位置,从而获利更高效。
- 利用SAR判断趋势反转点,精确定位入场点位
- 在高级时间框架操作,跟大趋势运行
- 止损点紧贴SAR,有效控制风险
- SAR指标存在滞后,可能出现超过止损点后再反转的情况。解决方法是适当放宽止损距离。
- 趋势巨大时,SAR的加速FACTOR会逐步放大,出现放量突破的可能。解决方法是限制FACTOR最大值。
- 在高级时间框架下,周期过长回撤时间久。可通过降低仓位规避风险。
- 优化入场条件,例如结合其他指标过滤信号
- 优化止损策略,例如移动止损、区间止损等
- 优化仓位管理,例如固定份额、动态调整等
- 在更高级别的时间框架操作,例如季度线、年线
- 结合机器学习算法动态优化参数
该策略整体思路清晰,通过在高时间框架判断趋势,可有效跟随大方向操作。同时SAR指标较为精确地定位趋势转折点,也使止损风险控制到较小水平。后续可从入场条件、止损策略、仓位管理等方面进行优化,使策略更加稳定高效。
||
This strategy is based on the alternating operations of the SAR indicator across different timeframes. The strategy calculates the SAR indicator in 15-minute, daily, weekly and monthly timeframes, and trades in the weekly timeframe. It goes long when the weekly SAR crosses above the highest price and goes short when crossing below the lowest price.
The Parabolic SAR (SAR) indicator represents parabolic SAR, which judges the trend direction by calculating the relationship between the current price and historical prices. When the price breaks through the SAR point, it indicates a trend reversal.
This strategy calculates SAR values in 15-minute, daily, weekly and monthly timeframes, respectively. The formula is:
SAR = Previous SAR + Acceleration Factor * (Highest Price - Previous SAR) # Uptrend
SAR = Previous SAR + Acceleration Factor * (Lowest Price - Previous SAR) # Downtrend
The initial acceleration factor is set at 0.02, and will gradually increase up to a maximum of 0.2 as the trend extends.
The strategy generates trading signals in the weekly timeframe. It goes long when the weekly SAR crosses above the highest price, with SAR value as the stop loss. It goes short when SAR crosses below the lowest price, with SAR as the stop loss.
By determining the trend on a higher timeframe and setting a more precise stop loss level, the strategy aims to profit more efficiently.
- SAR indicator accurately locates trend reversal points for entering the market
- Trading in higher timeframes follows the major trend
- Stop loss stuck to SAR effectively controls risks
- SAR lag may cause trend to reverse after hitting stop loss. Solution is to allow wider stop loss distance.
- Acceleration factor may expand dramatically on huge trends, causing stop loss to be penetrated. Solution is to limit maximum factor size.
- Long drawdown periods during long cycles on higher timeframes. Solution is to reduce position sizes.
- Optimize entry conditions, e.g. combine with other indicators
- Enhance stop loss mechanisms, e.g. trailing stop loss, zone stop loss
- Refine position sizing rules, e.g. fixed fractional, dynamic adjustment
- Operate on even higher timeframes, e.g. quarterly, annually
- Dynamically optimize parameters via machine learning
The strategy has clear logic of riding trends on higher timeframes using SAR indicator to locate reversals and set stop loss. Entry signals and risk management could be further improved. With optimizations in areas like entries, stops and position sizing, it can become more stable and profitable.
[/trans]
Strategy Arguments
| Argument | Default | Description |
|---|---|---|
| v_input_1 | 15 | Resolution |
| v_input_2 | D | Resolution |
| v_input_3 | W | Resolution |
| v_input_4 | M | Resolution |
Source (PineScript)
/*backtest
start: 2023-01-09 00:00:00
end: 2024-01-15 00:00:00
period: 1d
basePeriod: 1h
exchanges: [{"eid":"Futures_Binance","currency":"BTC_USDT"}]
*/

//@version=2
strategy ("SAR alternating timeframe", overlay=true)

//resolution
res1=input("15", title="Resolution")
res2=input("D", title="Resolution")
res3=input("W", title="Resolution")
res4=input("M", title="Resolution")

//output functions
out = sar(0.02,0.02,0.2)

// request.security
SAR1 = request.security(syminfo.tickerid, res1, out)
SAR2 = request.security(syminfo.tickerid, res2, out)
SAR3 = request.security(syminfo.tickerid, res3, out)
SAR4 = request.security(syminfo.tickerid, res4, out)

//Plots
//plot(SAR1 , title="SAR 15", color = red, linewidth = 2)
//plot(SAR2 , title="SAR D", color = green, linewidth = 3)
plot(SAR3 , title="SAR W", color =blue, linewidth = 4)
//plot(SAR4 , title="SAR W", color =purple, linewidth = 5))


/////////////////////////////////////////////////////////////////////
//trade
if (SAR3 >= high)
    strategy.entry("ParLE", strategy.long, stop=SAR3, comment="ParLE")
else
    strategy.cancel("ParLE")

if (SAR3 <= low)
    strategy.entry("ParSE", strategy.short, stop=SAR3, comment="ParSE")
else
    strategy.cancel("ParSE")
Detail
https://www.fmz.com/strategy/438932
Last Modified
2024-01-16 14:18:20
