Name
SSS
Author
ChaoZhang
Strategy Description
This strategy uses combined indicators to create LONG entry points, the strategy was first found by saudALThaidy.
How to use: Open your asset and pick a timeframe between 5min and 2hours (recommended: 30min, 45min), the strategy will give entry points itself, you can monitor and take profit manually(recommended), or you can use the exit setup.
exit setup: Take Profit : close the trade and take profit after the specified percentage from the entry point gets hit. Use Stop Percentage : if false, trade will be closed if it gets below MA line, if true it will use the next set up. StopLose Percentage : specify a percentage to close the trade if the asset price goes below it.
Important Notes: As saudALThaidy states that the strategy must be used with -heiken ashi- candles for the best result. for best use of the strategy, use (Take Profit = 1,Use Stop Percentage=false) to get every trade, and take profit manually when ever you see the best.
For any notes on the strategy to be edited, or for another strategies ideas please comment.
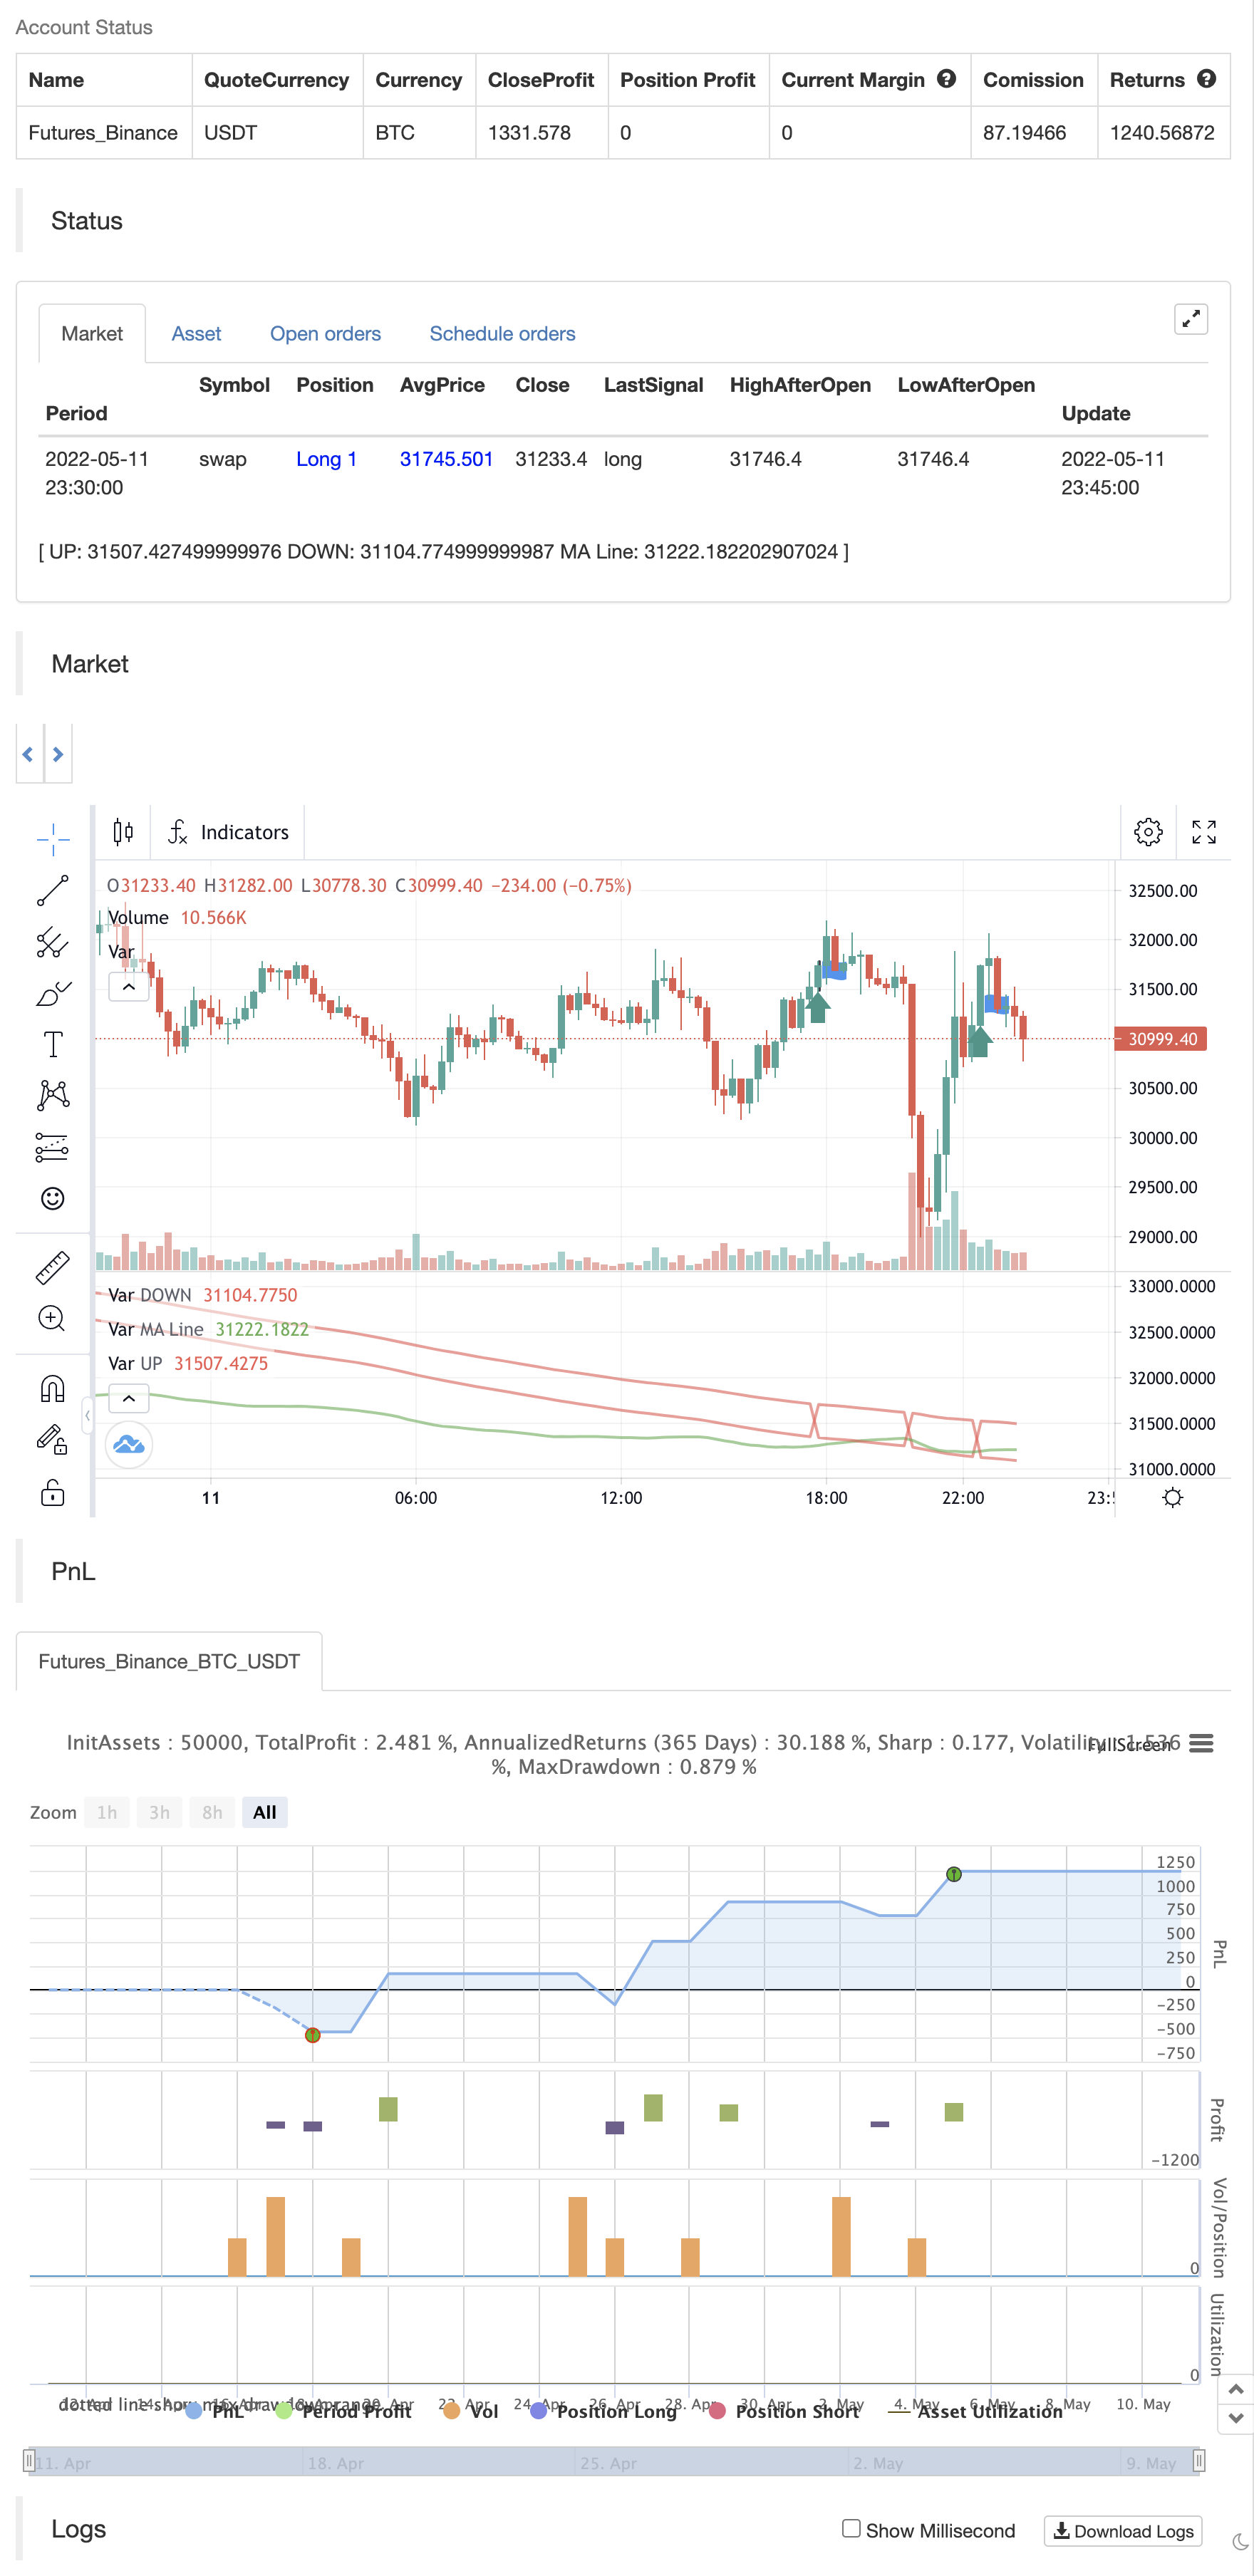
backtest
Strategy Arguments
| Argument | Default | Description |
|---|---|---|
| v_input_1 | #505050 | Wick Color |
| v_input_int_1 | 100 | MA Line Length |
| v_input_float_1 | true | Take Profit Percentage |
| v_input_bool_1 | false | Use Stop Percentage |
| v_input_float_2 | true | StopLose Percentage |
Source (PineScript)
/*backtest
start: 2022-04-12 00:00:00
end: 2022-05-11 23:59:00
period: 15m
basePeriod: 5m
exchanges: [{"eid":"Futures_Binance","currency":"BTC_USDT"}]
*/

// This source code is subject to the terms of the Mozilla Public License 2.0 at https://mozilla.org/MPL/2.0/
// © Sultan_shaya

//@version=5
//strategy("SSS", overlay=true, initial_capital=1000,currency=currency.USD,default_qty_type=strategy.percent_of_equity,default_qty_value=100,pyramiding=0)
//SSS = Sultan+Saud Strategy

//The original idea of the code belonges to saudALThaidy
//The strategy code is basically made out of two other indicators, edited and combined by me.
// 1- NSDT HAMA Candles => https://www.tradingview.com/script/k7nrF2oI-NSDT-HAMA-Candles/
// 2- SSL Channel => https://www.tradingview.com/script/6y9SkpnV-SSL-Channel/


//MA INFO
WickColor = input(color.rgb(80, 80, 80, 100), title='Wick Color', tooltip='Suggest Full Transparency.')
LengthMA = input.int(100, minval=1, title='MA Line Length', inline='MA Info')
TakeProfit = input.float(1, minval=0, title='Take Profit Percentage', step=1)
UseStopLose = input.bool(false, title='Use Stop Percentage')
StopLose = input.float(1, minval=0, title='StopLose Percentage', step=1)

MASource = close

ma(source, length, type) =>
    type == "SMA" ? ta.sma(source, length) :
     type == "EMA" ? ta.ema(source, length) :
     type == "SMMA (RMA)" ? ta.rma(source, length) :
     type == "WMA" ? ta.wma(source, length) :
     type == "VWMA" ? ta.vwma(source, length) :
     na

ma1_color  = color.green
ma1 = ma(high, 200, "SMA")

ma2_color  = color.red
ma2 = ma(low, 200, "SMA")

Hlv1 = float(na)
Hlv1 := close > ma1 ? 1 : close < ma2 ? -1 : Hlv1[1]
sslUp1   = Hlv1 < 0 ? ma2 : ma1
sslDown1 = Hlv1 < 0 ? ma1 : ma2

Color1 = Hlv1 == 1 ? ma1_color : ma2_color
fillColor1 = color.new(Color1, 90)

highLine1 = plot(sslUp1, title="UP", linewidth=2, color = Color1)
lowLine1 = plot(sslDown1, title="DOWN", linewidth=2, color = Color1)

OpenLength = 25
HighLength = 20
LowLength = 20
CloseLength = 20


SourceOpen = (open[1] + close[1]) / 2
SourceHigh = math.max(high, close)
SourceLow = math.min(low, close)
SourceClose = (open + high + low + close) / 4

funcCalcMA1(src1, len1) => ta.ema(src1, len1)
funcCalcOpen(SourceOpen, OpenLength) => ta.ema(SourceOpen, OpenLength)
funcCalcHigh(SourceHigh, HighLength) => ta.ema(SourceHigh, HighLength)
funcCalcLow(SourceLow, LowLength) => ta.ema(SourceLow, LowLength)
funcCalcClose(SourceClose, CloseLength) => ta.ema(SourceClose, CloseLength)

MA_1 = funcCalcMA1(MASource, LengthMA)

CandleOpen = funcCalcOpen(SourceOpen, OpenLength)
CandleHigh = funcCalcHigh(SourceHigh, HighLength)
CandleLow = funcCalcLow(SourceLow, LowLength)
CandleClose = funcCalcClose(SourceClose, CloseLength)

//PLOT CANDLES
//-------------------------------NSDT HAMA Candels
BodyColor = CandleOpen > CandleOpen[1] ? color.green : color.red
//barcolor(BodyColor)
//plotcandle(CandleOpen, CandleHigh, CandleLow, CandleClose, color=BodyColor, title='HAMA Candles', wickcolor=WickColor, bordercolor=na)
plot(MA_1, title='MA Line', color=BodyColor, style=plot.style_line, linewidth=2)

//------------------------------SSL Channel


plot_buy = false
avg = ((high-low)/2)+low
LongCondition = (Hlv1 == 1 and Hlv1[1] == -1) and (BodyColor == color.green) and (MA_1 < avg) and (CandleHigh < avg) and (strategy.opentrades == 0)
if LongCondition
    strategy.entry("BUY HERE", strategy.long)
    plot_buy := true

base = strategy.opentrades.entry_price(0)
baseProfit = (base+((base/100)*TakeProfit))
baseLose = (base-((base/100)*StopLose))

strategy.exit("SELL HERE","BUY HERE",limit = baseProfit)
if UseStopLose and (close < MA_1)
    strategy.exit("SELL HERE","BUY HERE",stop = baseLose)
if not UseStopLose and (close < MA_1)
    strategy.exit("SELL HERE","BUY HERE", stop = close)

plotshape(plot_buy, title="Buy Label", text="Buy", location=location.belowbar, style=shape.labelup, size=size.tiny, color=Color1, textcolor=color.white)

fill(highLine1, lowLine1, color = fillColor1)
Detail
https://www.fmz.com/strategy/362842
Last Modified
2022-05-13 12:30:11
