Name
STARC通道回测策略STARC-Channel-Backtest-Strategy
Author
ChaoZhang
Strategy Description
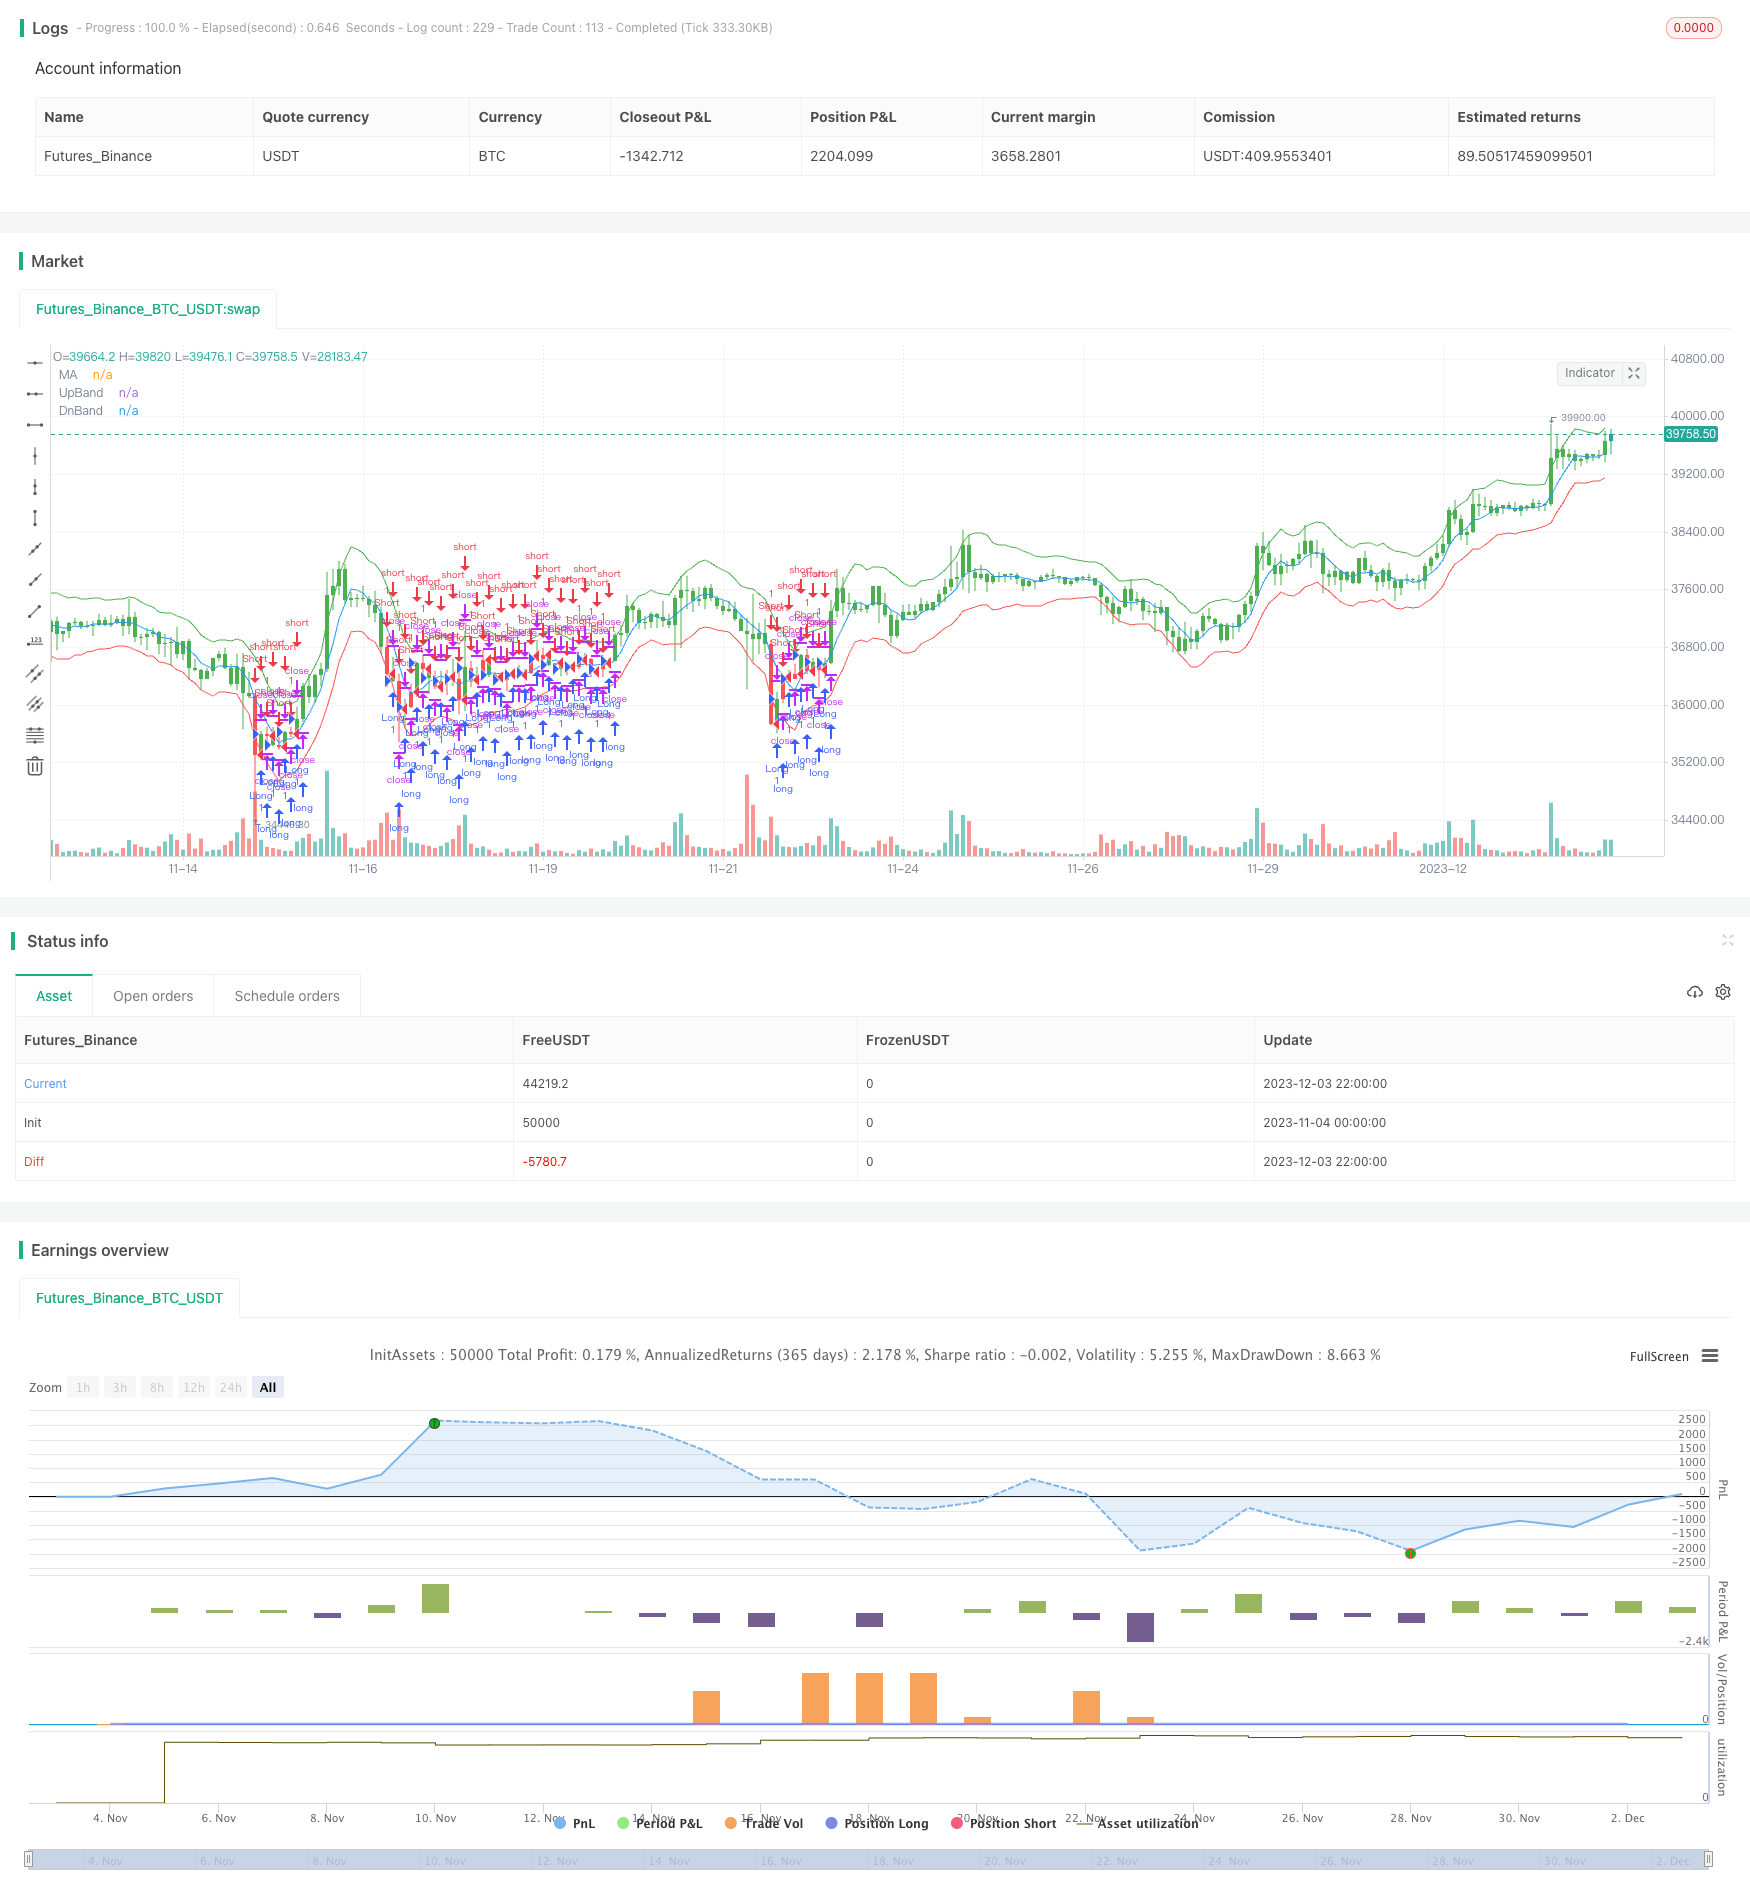
STARC通道回测策略是基于STARC指标的量化交易策略。该策略通过构建STARC上下通道,实现突破买入和突破卖出的交易信号生成。同时,策略内置长短仓切换机制,可以适应不同市场环境。
STARC通道回测策略的核心是STARC指标。该指标包括:
- 基准线:n日简单移动平均线SMA
- 上轨:SMA + K × 平均真实波动幅度ATR
- 下轨:SMA - K × ATR
当收盘价大于上轨时,产生买入信号;当收盘价低于下轨时,产生卖出信号。
该策略每日计算STARC通道的上下轨,并判断收盘价是否突破上下轨生成交易信号。同时,策略设置了反转参数,可以在长仓和空仓之间切换,适应不同市场行情。
STARC通道回测策略具有以下优势:
- 使用STARC指标构建上下通道,回测效果良好;
- 内置长空仓切换机制,可以适应多种市场环境;
- 参数设置灵活,K值和均线长度都可以调整优化;
- 策略规则清晰易懂,容易理解实现;
- 可视化指标,直观判断市场位置。
STARC通道回测策略也存在一定的风险:
- STARC指标常用于中长线交易,短期效果可能不佳;
- 突破交易容易被套,需要严格止损;
- 反转参数设置不当可能导致过于频繁交易;
- 参数优化不当可能导致曲线拟合。
需要采取如下措施防范风险:
- 选择合适的交易周期,如日线等中长线周期;
- 设置合理的止损位置,控制单笔损失;
- 审慎设置反转参数,避免频繁切换仓位;
- 多组合参数优化,防止过拟合。
STARC通道回测策略的主要优化方向包括:
- 优化参数:调整均线长度、K值、ATR周期等参数,寻找最优参数组合;
- 加入止损机制:设置移动止损、时间止损、百分比止损等,控制风险;
- 结合其他指标:加入成交量、布林带等指标进行过滤,提高效率;
- 动态调整参数:根据市场变化自动优化调整参数,提高稳定性。
这些优化方向能够在控制风险的前提下,提高策略的收益率和稳定性。
STARC通道回测策略整体效果良好,基于STARC指标实现了中长线突破交易。策略优势是使用STARC通道产生交易信号稳定,同时设置反转机制可以适应市场变化。我们也需要防范shean,设置止损和优化参数,使策略更稳定高效。总的来说,该策略是中长线突破交易的有效工具。
||
The STARC Channel Backtest Strategy is a quantitative trading strategy based on the STARC indicator. The strategy constructs the upper and lower STARC channels to generate breakout buy and sell trading signals. It also incorporates long and short position switching mechanisms to adapt to different market environments.
The core of the STARC Channel Backtest Strategy is the STARC indicator, which includes:
- Baseline: n-day simple moving average SMA
- Upper band: SMA + K × Average True Range ATR
- Lower band: SMA - K × ATR
It generates a buy signal when the closing price breaks through the upper band, and a sell signal when the closing price breaks through the lower band.
The strategy calculates the upper and lower rails of the STARC channel daily and judges if the closing price breaks through them to generate trading signals. It also sets a reverse parameter to switch between long and short positions to adapt to different market conditions.
The STARC Channel Backtest Strategy has the following advantages:
- Construct upper and lower channels with the STARC indicator, good backtesting results;
- Built-in long and short position switching mechanisms to adapt to various market environments;
- Flexible parameter settings, both K values and moving average lengths can be adjusted and optimized;
- Clear and easy-to-understand strategy rules that are easy to understand and implement;
- Visualized indicators to intuitively judge market positions.
The STARC Channel Backtest Strategy also has some risks:
- The STARC indicator is often used for medium-long term trading, and short-term results may not be optimal;
- Breakout trading is prone to getting caught in whipsaws which requires strict stop losses;
- Improper reverse parameter settings can lead to excessive frequent trading;
- Improper parameter optimization can lead to curve fitting.
The following measures should be taken to mitigate risks:
- Select appropriate trading cycles, such as daily and other medium-long term cycles;
- Set reasonable stop loss positions to control single trade losses;
- Carefully set reverse parameters to avoid excessive switching of positions;
- Multi-parameter optimization to prevent overfitting.
The main optimization directions for the STARC Channel Backtest Strategy include:
- Parameter optimization: adjust moving average lengths, K values, ATR cycles and other parameters to find the optimal parameter combination;
- Add stop loss mechanisms: set trailing stop loss, time stop loss, percentage stop loss etc. to control risks;
- Incorporate other indicators: add trading volume, Bollinger Bands etc. for filtration to improve efficiency;
- Dynamically adjust parameters: automatically optimize and adjust parameters based on market changes to improve stability.
These optimization directions can improve the strategy's return and stability while controlling risks.
The overall effect of the STARC Channel Backtest Strategy is good. It implements medium-long term breakout trading based on the STARC indicator. The advantage of the strategy is using the STARC channel to generate stable trading signals, while setting reverse mechanisms to adapt to market changes. We also need to mitigate risks by setting stop losses and optimizing parameters to make the strategy more stable and efficient. In general, this strategy is an effective tool for medium-long term breakout trading.
[/trans]
Strategy Arguments
| Argument | Default | Description |
|---|---|---|
| v_input_1 | 5 | LengthMA |
| v_input_2 | 15 | LengthATR |
| v_input_3 | 1.33 | K |
| v_input_4 | false | Trade reverse |
Source (PineScript)
/*backtest
start: 2023-11-04 00:00:00
end: 2023-12-04 00:00:00
period: 2h
basePeriod: 15m
exchanges: [{"eid":"Futures_Binance","currency":"BTC_USDT"}]
*/

//@version=2
////////////////////////////////////////////////////////////
//  Copyright by HPotter v1.0 23/04/2018
// A type of technical indicator that is created by plotting two bands around
// a short-term simple moving average (SMA) of an underlying asset's price.
// The upper band is created by adding a value of the average true range
// (ATR) - a popular indicator used by technical traders - to the moving average.
// The lower band is created by subtracting a value of the ATR from the SMA.
// STARC is an acronym for Stoller Average Range Channels. The indicator is
// named after its creator, Manning Stoller.
//
// You can change long to short in the Input Settings
// WARNING:
//  - For purpose educate only
//  - This script to change bars colors.
////////////////////////////////////////////////////////////
strategy(title="STARC Bands Backtest", overlay = true)
LengthMA = input(5, minval=1)
LengthATR = input(15, minval=1)
K = input(1.33, minval=0.01, step = 0.01)
reverse = input(false, title="Trade reverse")
xMA = sma(close, LengthMA)
xATR = atr(LengthATR)
xSTARCBandUp = xMA + xATR * K
xSTARCBandDn = xMA - xATR * K
pos = iff(close > xSTARCBandUp, 1,
       iff(close < xSTARCBandDn, -1, nz(pos[1], 0)))
possig = iff(reverse and pos == 1, -1,
          iff(reverse and pos == -1, 1, pos))
if (possig == 1)
    strategy.entry("Long", strategy.long)
if (possig == -1)
    strategy.entry("Short", strategy.short)
barcolor(possig == -1 ? red: possig == 1 ? green : blue )
plot(xMA, color=blue, title="MA")
plot(xSTARCBandUp, color = green, title="UpBand")
plot(xSTARCBandDn, color=red, title="DnBand")
Detail
https://www.fmz.com/strategy/434325
Last Modified
2023-12-05 14:52:20
