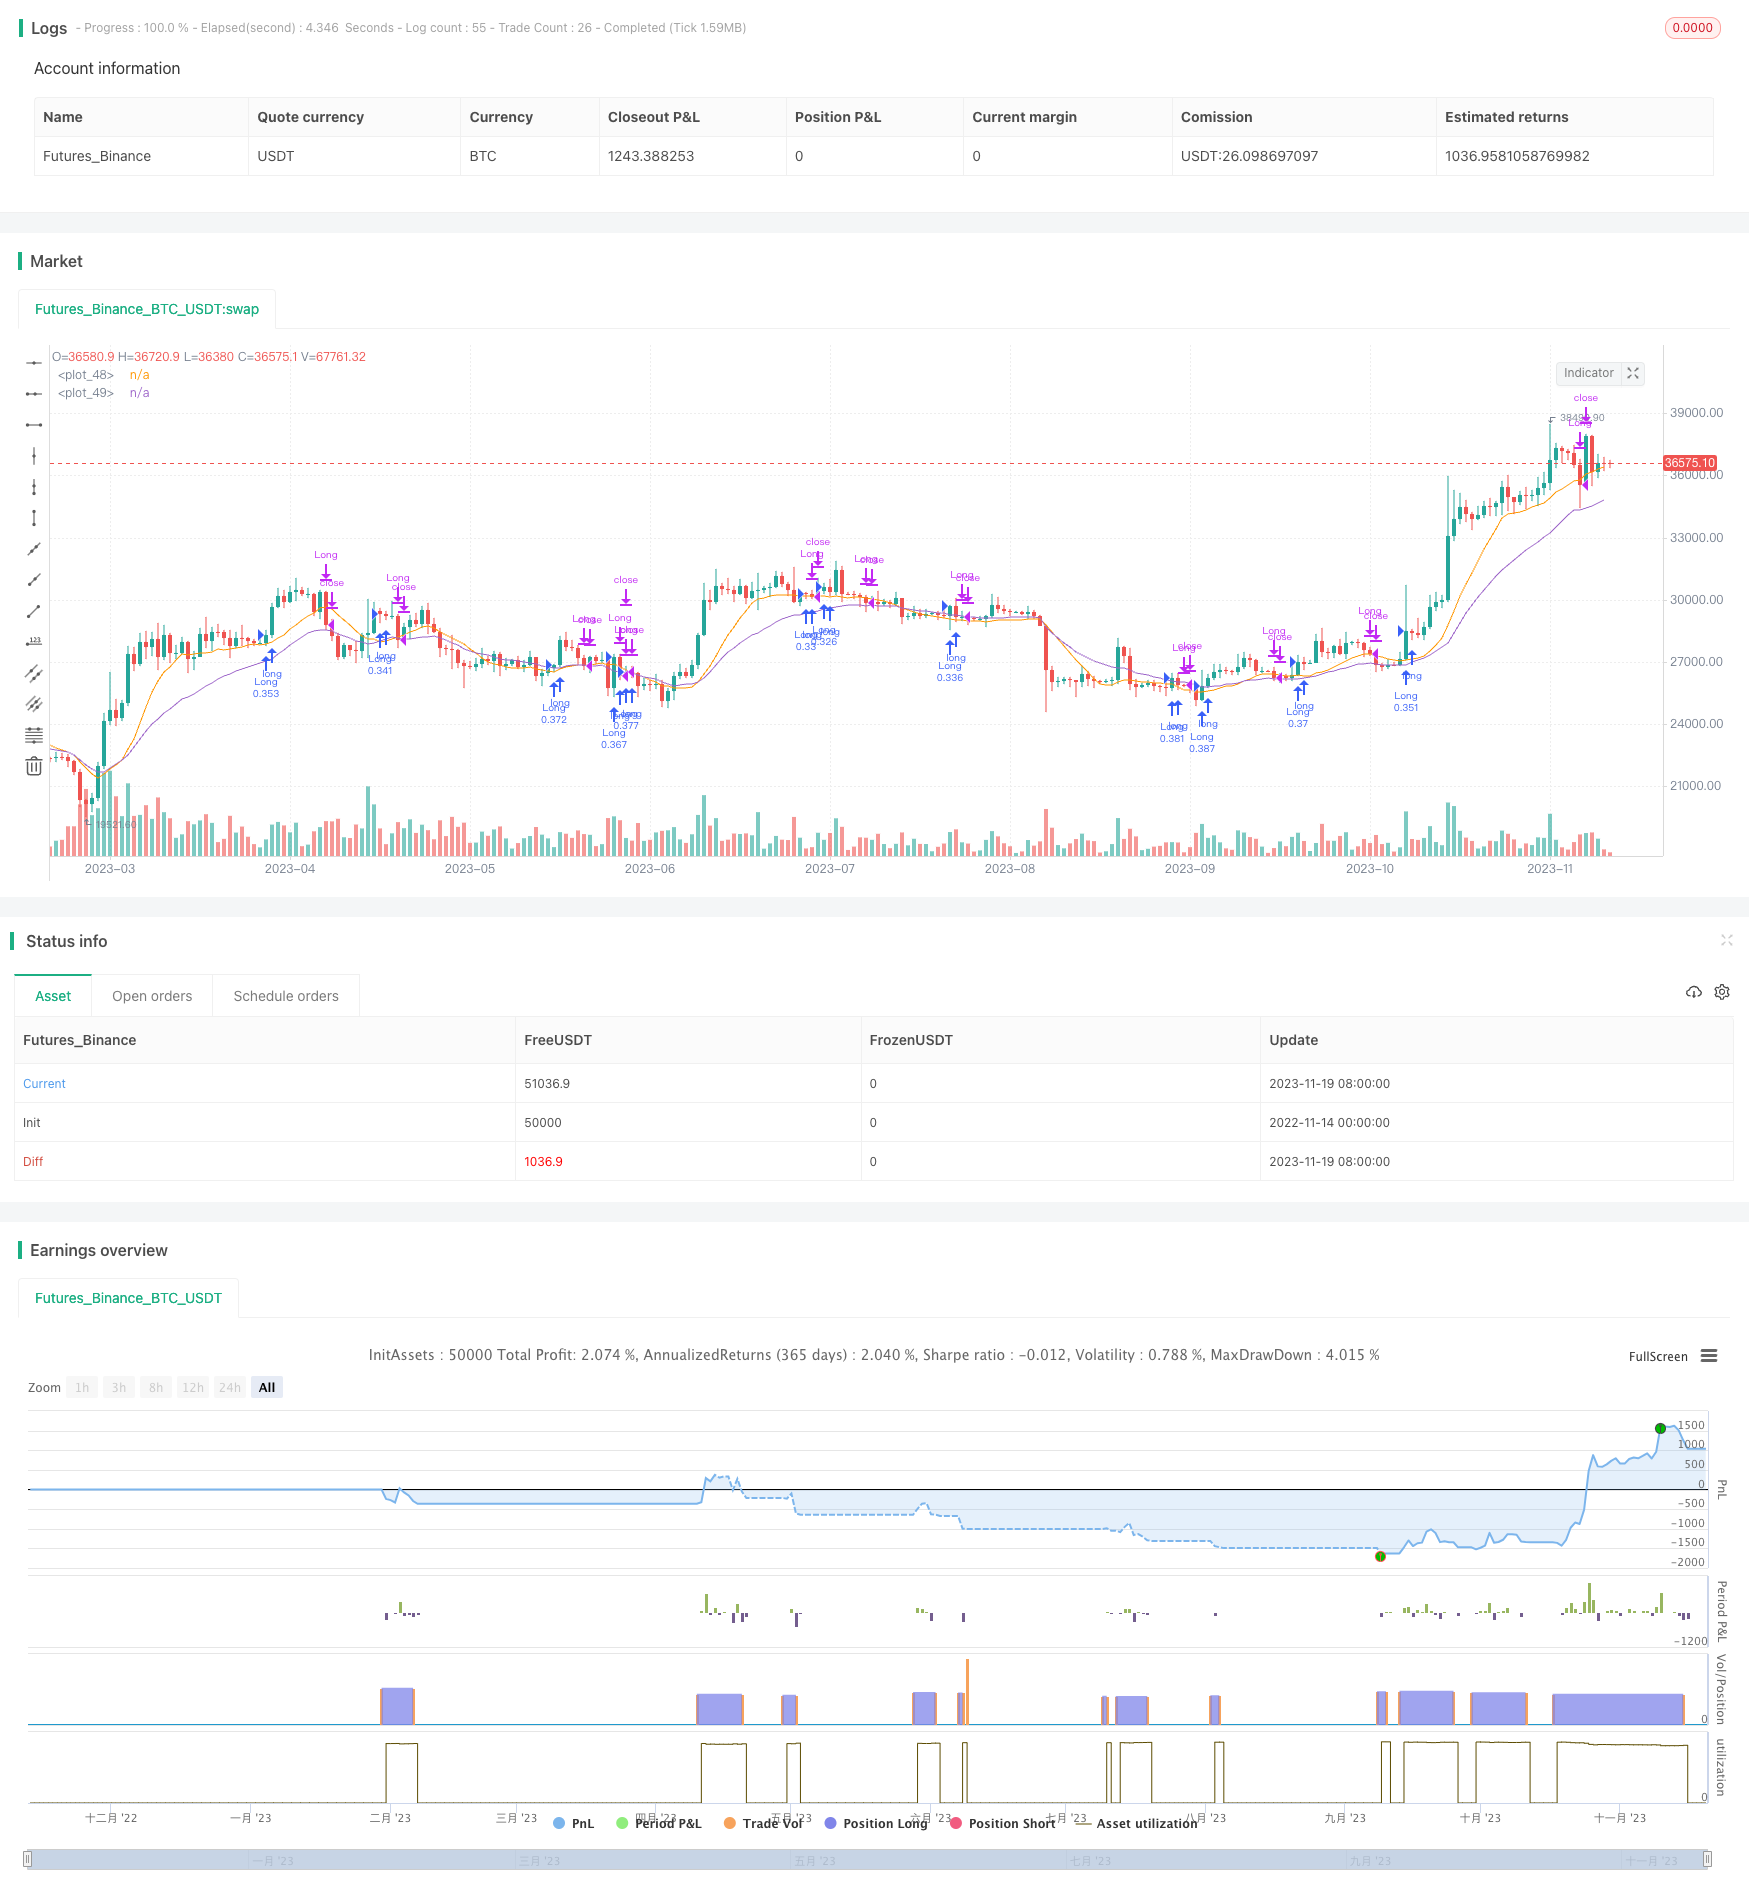
Name
VRSI-EMA交叉与VMACD融合的波浪寻找者策略VSTOCHASTIC-RSI-EMA-CROSSOVER-COMBINED-WITH-VMACD-WAVEFINDER-STRATEGY
Author
ChaoZhang
Strategy Description
这是一个结合随机RSI, EMA交叉和VMACD的策略,用于识别市场的反转点, 在下跌趋势即将反转的时候表现最佳。它会在符合条件时产生买入信号。
该策略主要基于以下几个指标的组合:
- 随机RSI(随机指数平滑移动平均线):用于识别超买超卖现象
- EMA(指数移动平均线)快线和慢线的交叉:判断趋势和可能的反转
- VMACD(量加权MACD):用于确认反转信号
当随机RSI从超卖区域反弹,并且EM快线上穿慢线,同时VMACD也开始上升的时候,就会产生买入信号。此外,如果短期价格突破10周期的SMA(简单移动平均线),也会作为辅助信号产生买入。
该策略会实时跟踪这几个指标的变化,并计算一定长度后的SMA, EMA等信息。当触发买入条件后,就会使用固定数量的合约进行买入开仓。之后如果触发止损条件,例如回撤5%或者位于SMA线下方,就会平仓止损。
该策略结合了多个指标,能够有效识别市场反转机会。主要优势有:
- 随机RSI识别超买超卖的能力较强
- EMA交叉判断反转信号准确性高
- VMACD有效过滤假信号
- 多指标组合, 提高信号质量
- 采用短期SMA作为止损方式合理
综上,该策略可以有效抓住反转信号,在下跌到一定程度后建立多头头寸,从而获利。
尽管该策略有一定优势,但也存在一些风险需要注意,主要有:
- 市场可能并没有反转,继续下跌的系统性风险
- 当多个指标同时触发买入条件的概率不高,信号产生较少
- SMA止损可能过于主观,回撤控制效果一般
- 未考虑大幅震荡市场的情况
针对以上风险,可以通过以下方式进一步优化:
- 增加其他反转指标的组合,提高效果
- 采用时间止损和金额止损相结合的方式
- 对市场状态进行判断,在震荡行情避免建仓
- 优化止损逻辑,防止过于激进的止损被套
该策略主要可从以下方向进行进一步优化:
- 增加更多指标的组合,形成指标集群,提高信号质量
- 根据大类资产的特点选择最佳的参数,进行参数优化
- 增加机器学习算法,根据历史数据训练判断反转的概率
- 在回测时加入滑点,使结果更贴近实际交易
- 优化止损策略,使之更加平滑合理
- 检测趋势状态,区分震荡和趋势行情,避免盲目建仓
该VRSI-EMA交叉与VMACD融合的波浪寻找者策略,整体来说是一个不错识别下跌反转机会的策略。它结合多个指标形成买入信号,可以有效判定反转的时机。但也存在一些需要优化的方向,若经过进一步改进,该策略的实盘表现会更加出色。它代表了多指标融合这类量化策略的典型范例。
||
This is a strategy that incorporates Stochastic RSI, EMA crossovers and VMACD to identify market reversal points and performs best when a downtrend reversal is imminent. It will generate buy signals when conditions are met.
The strategy mainly relies on the combination of the following indicators:
- Stochastic RSI: To identify overbought and oversold conditions
- EMA Crossover between Fast EMA and Slow EMA: To determine trend direction and potential reversals
- VMACD: To confirm reversal signals
When Stochastic RSI bounces off the oversold region, the fast EMA crosses above the slow EMA, and at the same time VMACD starts to rise, a buy signal is generated. In addition, if the short term price breaks above the 10 period SMA, it also serves as an auxiliary signal to buy.
The strategy tracks the changes of these indicators in real time, and calculates SMA, EMA and other information over a fixed lookback period. When the buy conditions are triggered, it will buy and open position with a fixed number of contracts. Afterwards if the stop loss conditions are triggered, such as 5% drawdown or price below SMA line, positions will be closed for stop loss.
The strategy combines multiple indicators and is capable of effectively identifying market reversal opportunities. The main advantages are:
- Stochastic RSI is strong at catching overbought and oversold conditions
- EMA crossover has high accuracy at determining reversal signals
- VMACD helps filter fake signals effectively
- Combining multiple indicators improves signal quality
- Using short term SMA as a stop loss method is reasonable
In summary, this strategy can effectively capture reversal signals, establish long positions after declines to a certain degree, and thus gain profits.
Despite having some edge, there are also risks to note for this strategy:
- Market may not reverse and continues to decline - systematic risk
- Probability of multiple indicators triggering buy together is not high - few signals
- SMA stop loss could be too subjective and result in mediocre drawdown control
- Does not take into account high volatility market environments
Some ways to mitigate the risks:
- Add more reversal indicators for better combo effect
- Use timed stop loss combined with amount based stop loss
- Judge market conditions and avoid taking positions in choppy environments
- Optimize stop loss logic to prevent over-aggressive stop loss from being stopped out
Main areas that could be optimized for the strategy:
- Add more indicators to form an indicator cluster, improving signal quality
- Select optimal parameters based on characteristics of different asset classes
- Incorporate machine learning models to estimate reversal probability based on historical data
- Add slippage when backtesting to make results closer to live performance
- Refine stop loss methodology to become more smooth and reasonable
- Detect trend conditions to distinguish ranging and trending environments before entering positions blindly
Overall this VRSI-EMA Crossover with VMACD Wavefinder Strategy is quite capable of catching downtrend reversal opportunities. It generates buy signals effectively by combining multiple indicators to determine optimal timing for reversals. However, there remains some areas for improvements. If further optimized, the strategy's performance in live trading could be even better. It represents a typical example of a quantitative strategy based on the fusion of multiple indicators.
[/trans]
Strategy Arguments
| Argument | Default | Description |
|---|---|---|
| v_input_1 | 20 | length |
| v_input_2 | 2 | confirmBars |
| v_input_3 | 12 | Short period |
| v_input_4 | 26 | Long period |
| v_input_5 | 9 | Smoothing period |
| v_input_6 | 14 | lengthRSI |
| v_input_7 | 14 | lengthStoch |
| v_input_8 | 3 | smoothK |
| v_input_9 | 3 | smoothD |
| v_input_10 | 25 | OverSold |
| v_input_11 | 75 | OverBought |
Source (PineScript)
/*backtest
start: 2022-11-14 00:00:00
end: 2023-11-20 00:00:00
period: 1d
basePeriod: 1h
exchanges: [{"eid":"Futures_Binance","currency":"BTC_USDT"}]
*/

//@version=3
strategy("Wavefinder+", overlay=true)
length = input(20)
confirmBars = input(2)
price = close

slow = input(12, "Short period")
fast = input(26, "Long period")
signal = input(9, "Smoothing period")


maFast = ema( volume * close, fast ) / ema( volume, fast )
maSlow = ema( volume * close, slow ) / ema( volume, slow )
da = maSlow - maFast
maSignal = ema( da, signal )
dm=da-maSignal


source = close
lengthRSI = input(14, minval=8), lengthStoch = input(14, minval=5)
smoothK = input(3,minval=3), smoothD = input(3,minval=3)
OverSold = input(25), OverBought = input(75)
rsi1 = rsi(source, lengthRSI)
rsi2= rsi(low, 20)
k = sma(stoch(rsi1, rsi1, rsi1, lengthStoch), smoothK)
d = sma(k, smoothD)
k1= sma(stoch(rsi2, rsi2, rsi2, lengthStoch), smoothK)
d1= sma(k1, smoothD)
delta=k-d1
ma = ema(low, length)
ema5= ema(price,20)
sma= sma(price,10)
bcond = price < ma
lcond = price> ema5
bcount = 0
lcount= 0
bcount := bcond ? nz(bcount[1]) + 1 : 0
lcount := lcond ? nz(lcount[1]) + 1 : 0

if (lcount>1 and change(k)>3 and k>d and k<55 and rising(dm,1)) or ( k[1]-k[2]<-2 and k-k[1]>5 and k>35 and k<80) or (ma-sma>0.05*sma and rising(sma,3) and rising(dm,2))
    strategy.entry("Long", strategy.long, qty=10000/close)

if (bcount == confirmBars)
    strategy.close("Long")
if close<0.99*sma
    strategy.close("Long")

plot(0.99*sma)
plot(ma)

//hline(OverSold,color=blue)
//hline(OverBought,color=blue)

//plot(d, color=red)
//plot(k, color=green,title="k-line")

//(close-close[3]<-0.05*close[3]) or (close-close[2]<-0.05*close[2]) or (close-close[2]<-0.05*close[2]) or (close-close[4]<-0.05*close[4]) or
//plot(strategy.equity, title="equity", color=red, linewidth=2, style=areabr)
Detail
https://www.fmz.com/strategy/432808
Last Modified
2023-11-21 17:12:06
