-
Notifications
You must be signed in to change notification settings - Fork 95
New issue
Have a question about this project? Sign up for a free GitHub account to open an issue and contact its maintainers and the community.
By clicking “Sign up for GitHub”, you agree to our terms of service and privacy statement. We’ll occasionally send you account related emails.
Already on GitHub? Sign in to your account
New features #3
Comments
|
Hi, @arkihillel ! Thanks for your feedback!
These two points I'm going to do hopefully soon (need a few days free of other tasks to do it).
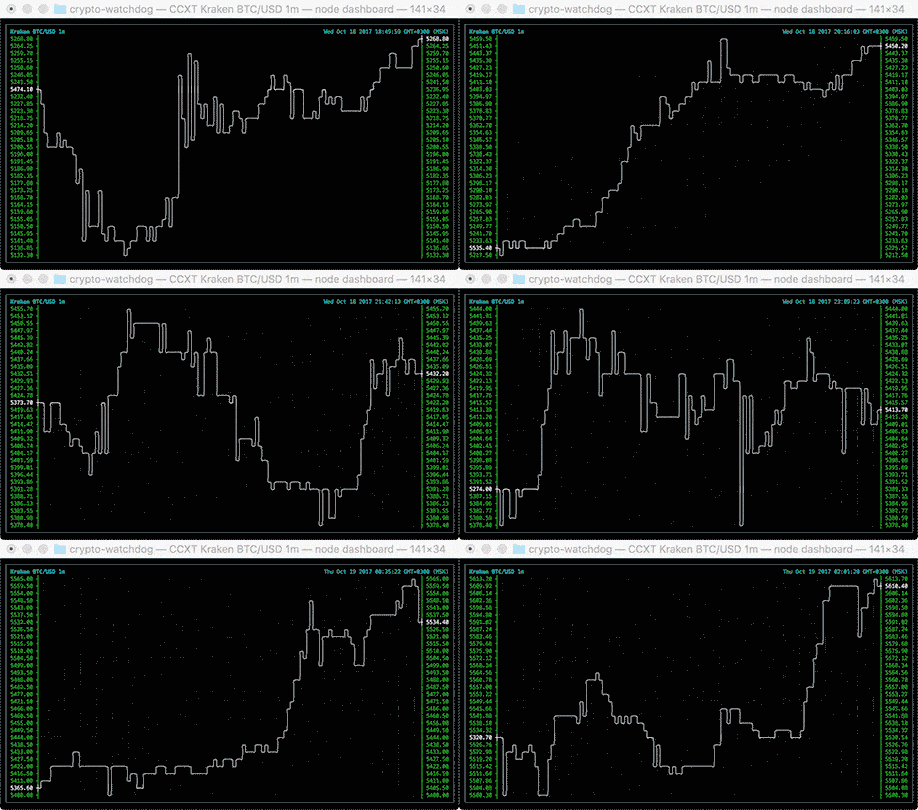
This cannot be done robustly for all terminals, so it's a little beyond the scope of this small library (I'm trying to keep it simple). But I did use the ansicolor and blessed together with asciichart to render a dashboard and a chart inside it, like this one: You can use any curses-like library to do the same. Alignment, center, full-width, full-height, etc... So blessed takes care of that, and can crop or scroll the "inside" content according to your rules. It also detects resizes, mouse events and much more. Hope this answers your questions. |
|
Yes - multiple series (with different colours) would be tops!! |
|
@kroitor I'm using this package (awesome, thank you!) and would like to try having 2 lines in the same chart. I ended up looking at the packages you suggested but didn't understand how to use them for this purpose. Can you elaborate, please? |
|
@theBliz it's a bit tricky, since drawing two lines requires changing the algorithm a bit, to find proper min/max values. After that you can plot each line separately using the same min/max range and then merge the two chart layers one over another skipping the whitespaces for top layer "opacity". I hope to add that functionality to the lib soon. |
|
+1 vote for the multi-line chart! Adding color would also be pretty neat. |

I like this simple, easy to use package that I use for node statistic clis.
I'm missing some nice to have options though:
Multiple series
Ability to see more than one series on the same chart
Colors
Ability to affect colors to lines. npm's
colorsmay be used thereMax width
Some charts can be way larger than a terminal. Detecting the terminal length and sub-setting the series sent may be a good way to tackle this issue
The text was updated successfully, but these errors were encountered: