After talking with Northwestern Football, we realized they currently are not using data to drive high-level decisions. In hopes to change this, we wanted to ease into this transition and work on a project that did not threaten the coaches in any way, while still providing analyses they can easily understand and trust. As a result, our project involves using play-level data to build a win/loss prediction model to then determine which attributes are the most important and influential to the outcome of football games. With this information, we can inform the NU football team on what aspects of the game they should be focusing on the most.
We sourced our data from profootballfocus.com which provides play-level data for all college football games. In order to keep the model as relevant as possible for Northwestern, we first limited the data to games within the BIG10 conference and only used games from 2014 and on. We wanted the model to be specific to the play-styles and trends of the BIG10. And because our end goal is to be able to provide specific features that are most important for victory, we could not use any black-box models. We also want to provide thresholds for the continuous features that change the outcome of the game. Given these constraints, we started with the following models: ZeroR, Decision Tree, Random Forest, Logistic Regression Classifier, Support Vector Machine, K-Nearest Neighbor, and Gradient Boosting Classifier.
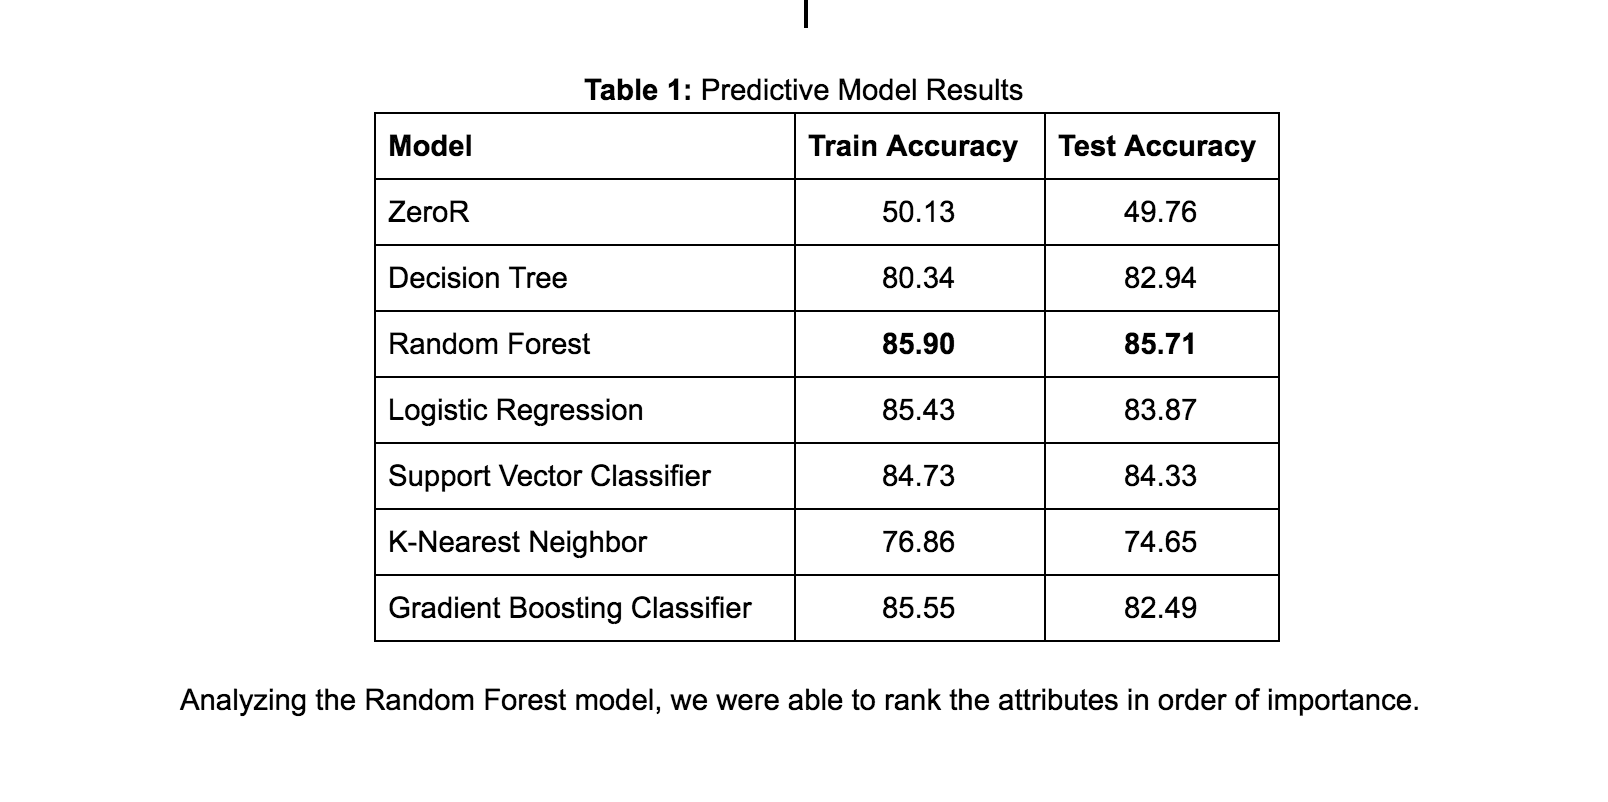
We found that the Random Forest classifier provided the best training and test accuracy of 85.9% and 85.71% respectively. The results of the other models we tried included:
We also evaluated the model looking at their Receiver Operating Characteristic (ROC) curves, which quantify sensitivity and specificity. The Random Forest model performed the best with this metric as well:
Figure 1: ROC Curve

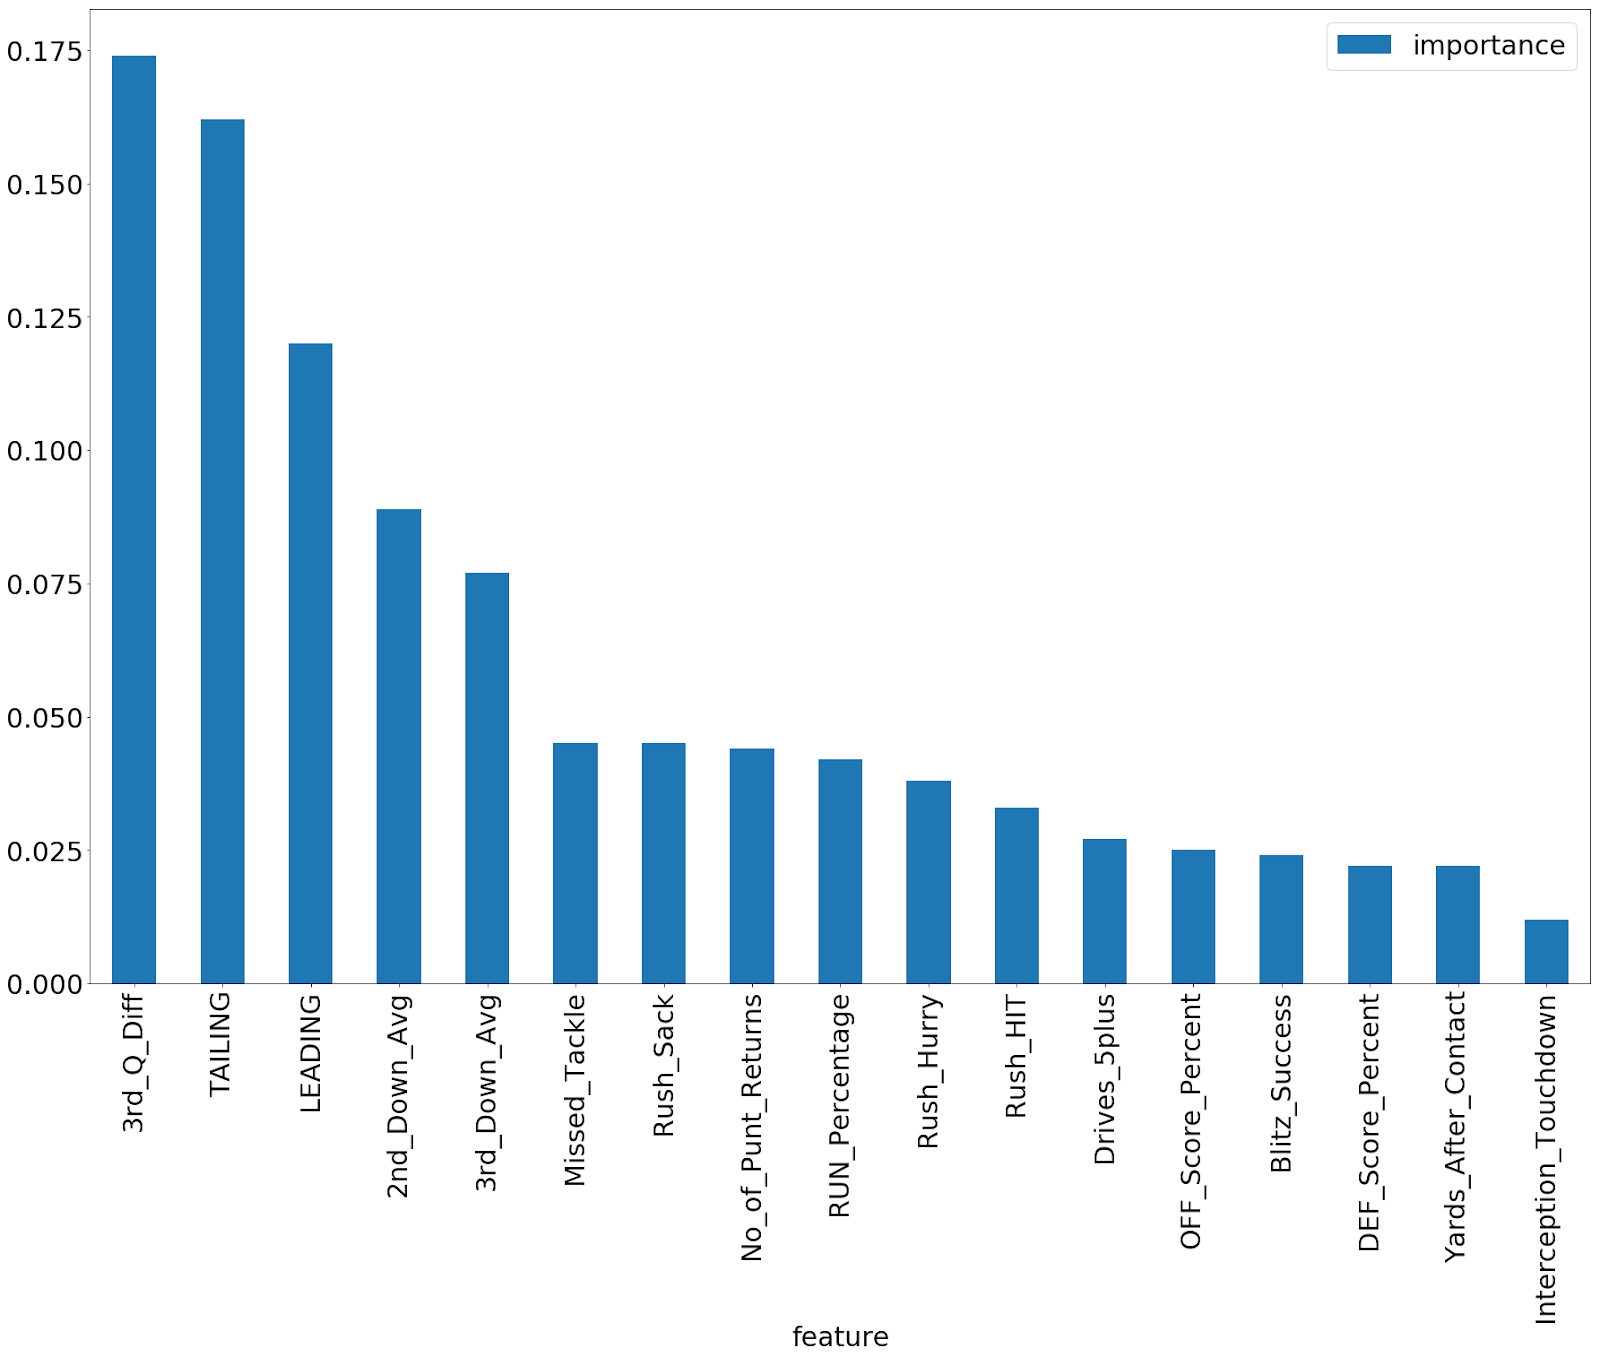
Analyzing the Random Forest model, we were able to rank the attributes in order of importance.
Figure 2: Feature Importance