![]()
Triangular plotting and diagnostics for FESOM2 + command line utility similar to fdiag using plotting suite of Patrick.Scholz@awi.de (former fesom2/view_pscholz folder). Data reading got updated to xarray, plotting got updated to cartopy, actually works well for python=3.9, 3.10, 3.11 and 3.12 (python 3.8 made recently some problems to resolve all the cartopy dependencies). It is tested upto dart mesh size (3M surface vertices) where it allows for a decend working speed (but only when used in parallel)
version: 0.3.0
In moment only possible by source files using pip:
git clone https://github.com/patrickscholz/tripyviewmake sure your conda environment uses python 3.9, 3.10, 3.11 or 3.12 (conda create --name py39 python=3.9; conda activate py39)
# -netcdf4>=1.6.1 can be used now, there were problems with the thread safety of
#  netcdf4 (occured especially on albedo), there was a workaround with
#  dask.config.set(scheduler="single-threaded") to ensure that each worker only
#  gets one thread
# -install libstdcxx-ng with conda since there is no pip package for it is needed
#  so that pyvista is able to plot interactively
conda install -c conda-forge libstdcxx-ng
cd tripyview
pip install -e .

# If you want to use the interactive features in tools/do_topo@elem_or_node.ipynb
# due to python issues you will need jupyter_server=1.23.6, jupyter_client=7.3.2,
# tornad=6.1 --> its the only combination where this features works in moment!!!
(pip install jupyter_server==1.23.6 jupyter_client==7.3.2 tornado==6.1)

# On my laptop i had problems with the classic notebook support beyond jupyter_server==2.0.0
# and had to downgrade it to jupyter_server<2.0.0. However on HPC albedo that didnt
# seems to be the case.
(pip install "jupyter_server<2.0.0")It is recommented to leave the template_notebooks unaltered since they are needed by the tripyrun (papermill)
batch diagnostic. If you want to work on them simply copy them to the ./notebook folder.
hmesh- plot horizontal fesom2 mesh in various projections (plot: mesh, topographie, vertice/element- resolution and area)


-
hslice- plot horizontal slices for ocean variable (compute depth and time averages) -
hslice_np- plot horizontal slices for ocean variable north polar stereographic projection -
hslice_sp- plot horizontal slices for ocean variable south polar stereographic projection -
hslice_clim- plot horizontal slices of temperature, salinity and density climatology (compute depth and time averages) -
hslice_clim_np- plot horizontal slices of temperature, salinity and density climatology in north polar stereographic projection -
hslice_clim_sp- plot horizontal slices of temperature, salinity and density climatology in south polar stereographic projection -
hslice_isotdep- plot horizontal slices of depth of distinct isotherm (default: 12°C isotherm) -
hslice_channel- plot horizontal slices of variables in the channel configuration (provide routine to make channel movie)

hquiver- plot horizontal arrow vector field in various projections

transect- plot point wise transects of 3d ocean variablestransect_clim- plot point wise transects of 3d temperature, salinity and density climatologytransect_transp- plot volume transport through arbitrary transects (model accurate transport)transect_transp_t- plot time-series of volume transport through arbitrary transects (fesom2 model accurate transport)transect_zmean- plot zonally averaged transects of 3d ocean variablestransect_zmean_clim- plot zonally averaged transects of 3d temperature, salinity and density climatology
![]()
![]()
![]()
vprofile- plot lines for averaged vertical profile of 3d ocean variablesvprofile_clim- plot lines for averaged vertical profile of 3d temperature, salinity and density climatology

-
hovm- plot hovmöller diagramms for 3d ocean variable over depth and time averaged over specific region that is defined by shapefile (see. tripyview/shapefiles/...) -
hovm_clim- plot hovmöller diagramms for temperature, salinity and density climatology over depth and time averaged over specific region that is defined by shapefile (see. tripyview/shapefiles/...) -
var_t- plots time-series of globally or shapefile (see. tripyview/shapefiles/...) averaged 2d and 3d variables
zmoc- plot meridional overturning circulation from vertical velocity (based on latitudinal binning), Globally, for the: Atlantic(amoc), Atlantic+Arctic(aamoc), Pacific(pmoc), Pacific+Indian Ocean(ipmoc) and Indian Ocean(imoc)


-
zmoc_t- plot time-series of atlantic meridional overturning circulation at specific latitudes (default: which_lats: [26, 40, 'max']) -
dmoc- plot meridional overturning circulation in density coordinates using FESOM2 density MOC diagnostics (graditues goes to Dmitry.Sidorenko@awi.de), Globally, for the: Atlantic(amoc), Atlantic+Arctic(aamoc), Pacific(pmoc), Pacific+Indian Ocean(ipmoc) and Indian Ocean(imoc) -
dmoc_srf- plot surface transformation of meridional overturning circulation in density coordinates -
dmoc_inner- plot inner transformation of meridional overturning circulation in density coordinates


dmoc_z,dmoc_srf_z,dmoc_inner_z- plot meridional overturning circulation in density coordinates remapped into z-coordinate space


-
dmoc_wdiap- plot diapycnal velocity for specific water-class -
dmoc_srfcbflx- plot surface buoyancy flux transformation for specific water-class -
dmoc_t- plot time-series of atlantic meridional overturning circulation in density coordinates at specific latitudes (default: which_lats: [26, 55, 'max']) -
hbarstreamf- plot horizontal barotropic streamfunction -
ghflx- plots global meridional heat flux computed from surface heatfluxes fh -
mhflx- plots global meridional heat flux computed from the the turbulent fluxes tempv, tempu -
zhflx- plots global zonal heat flux computed from the the turbulent fluxes tempv, tempu
- plot automatised figure multipanels depending on number of choosen datasets and number of panel columns ncol (the panel arrangement uses ideas from Nils.Brueggemann@mpimet.mpg.de)

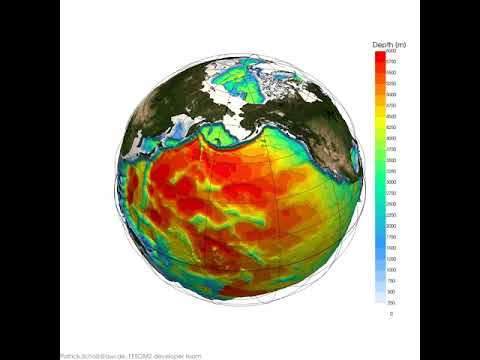
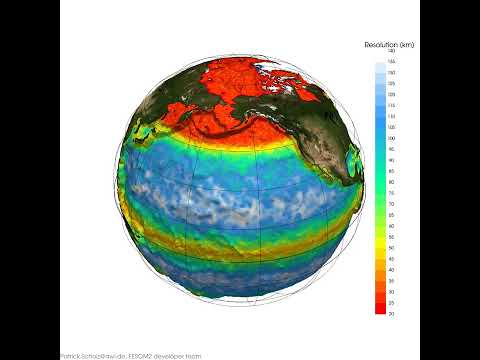
3dsphere- plot 3d model of FESOM grid with variables using pyvista interface. Full functionality can be only achieved with jupyter-lab (<4.0)
![]()
make 3D animations
-
tripyrun <workflowfile.yml>- command line diagnostics similar to fdiag (fdiag, served as a template, graditues go to Nikolay.Koldunov@awi.de), creates html files with linked plots. -
tripyrun <workflowfile.yml> -d <driver>- re-run one specific driver from .yml file -
tripyrun <workflowfile.yml> -d <driver> -v <var1 var2 ...>- re-run specific variable subset of one specific driver driver from .yml file -
tripyrun <workflowfile.yml> -r- for the case the diagnostic did not fully finish you can render the html file from hand based on hte saved json file. The json file is update after each finished driver section.

If you use the package please give the package or the author some credit.