-
Notifications
You must be signed in to change notification settings - Fork 108
3. Backend Devtools
Peter van der Walt edited this page May 6, 2020
·
5 revisions
OpenBuildsCONTROL runs on a nodejs/electronjs backend. The following document outlines how to use the --inspect switch to connect Chrome Devtools to the "server" side of CONTROL (the backend) to access debug information:
-
Install latest NodeJS: https://nodejs.org/en/download/
-
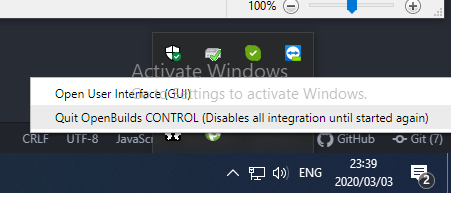
Quit the running instance of OpenBuildsCONTROL from the system tray menu
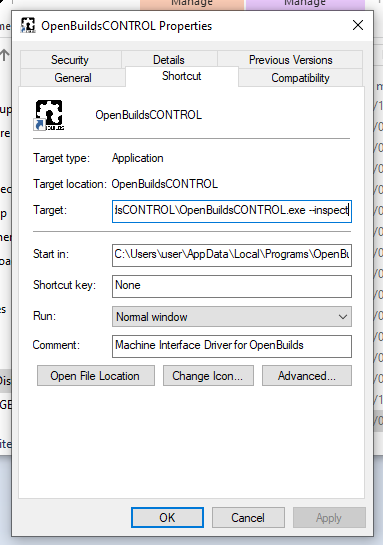
- Find the OpenBuildsCONTROL shortcut you use to start it with, and edit the shortcut. Find the Target and append "--inspect" to the end:
- Run the application using this shortcut.
- Open an instance of Google Chrome and press Ctrl+Shift+i to open Chrome Devtools
- You'll notice a Node button in the Devtools window:
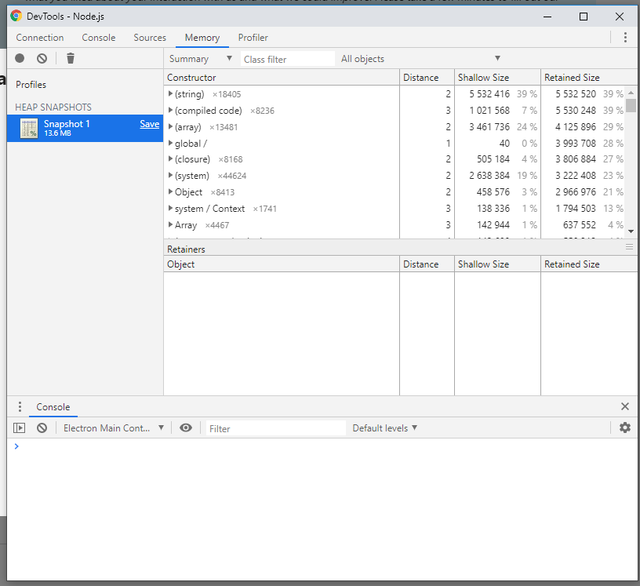
- Click this button to launch a Devtools instance connected to the OpenBuildsCONTROL backend process:
- Use the performance/profiler tab to gather a process profile, and the memory tab to grab a to gather stack, etc to debug the backend. Save them to disk and attach to bug reports


