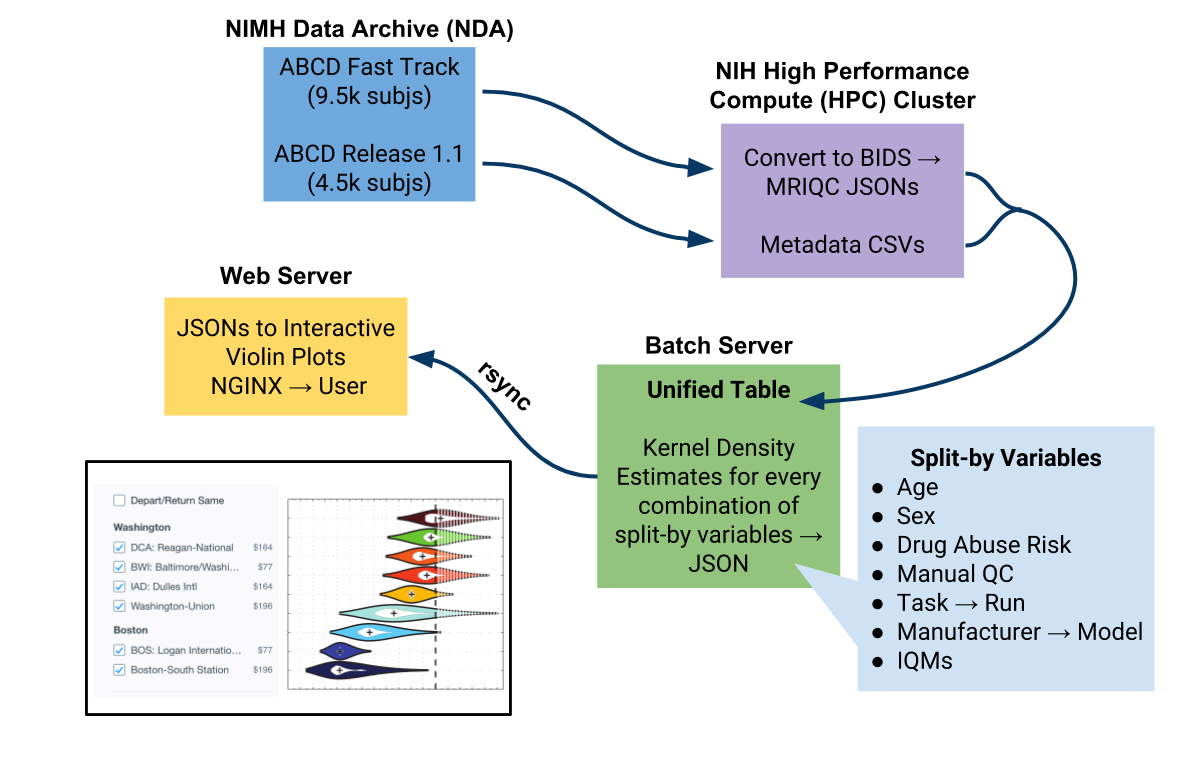
This is one of the projects from the February 2019 NCBI collaborative biodata science hackathon [http://biohackathons.github.io]. Our group is working on a project to automatically QC the ABCD study data and provide interactive visualizations of the data.
This project is composed of three github repos (abcdqc_webserver, abcdqc_batchserver, abcdqc_hcp_notebooks) that work on two AWS instances and utilize the NIH high performance computing cluster.
This repo contain the code running the NGINX webserver on the AWS client that serves the interactive visualizations from http://abcdqc.org
The Adolescent Brain Cognitive Development (ABCD) study will track approximately 10,000 nine- and ten-year-old children longitudinally throughout adolescence and early adulthood. Approximately half the enrolled participants were identified as likelier to engage in high risk behaviors and/or develop mental health problems during adolescence. It is the largest neuroimaging study of this type, and aims to track the arc of mental health development within a nationally-representative sample. Data are generated by 21 imaging centers throughout the United States, with imaging acquisitions and parameters optimized for better compatibility across 3T scanners. Imaging data include T1-, T2- and diffusion-weighted structural scans and functional MRI. Both resting state and task-based fMRI scans are collected (Casey et al., 2018).
In partnership with the NIMH Data Archive (NDA), the ABCD Study releases fast-track data every month since June 2017. The fast-track data contains unprocessed neuroimaging data and rudimentary demographics. Processed and anonymized data including all the assessment criteria are released to the research community annually.
This project uses both the ABCD fast-track data and the available ABCD annual releases (currently Release 1.1), creates a uniformly bid-formatted release of the data, and runs the data through the MRI Quality Control (MRIQC) tool using the NIH High Performance Compute (HPC) Cluster. MRIQC calculates a variety of image-quality metrics (IQMs) and generates a summary JSON file per subject. On the project's batch server, this data is put into a unified table and sorted by selected variables (including age, sex, drug abuse risk, manual QC score, task type and run number, manufacturer and model, and the IQMs). To preserve participant confidentiality, no identifying information is tranferred from the batch server to the webserver. Instead, Kernel Density Estimates (KDEs) for each combination of variables are calculated and converted into JSONs. On the webserver, these JSONs are converted to interactive violin plots. These interactive visualizations of the QC results are available at [http://abcdqc.org]. Data can be sorted and viewed at different levels to compare different IQMs.
This project allows the user to visually compare and analyze the ABCD data while protecting participant confidentiality. There are many potential applications for this tool, including making comparisons by scanner manufacturer or model, analyzing the impact of age, sex, and other variables on iamge quality, comparing the ABCD Study’s IQMs to the IQMs of other publically available datasets, and creating a predictive model for future datasets.
To build the website, cd abcd-client; npm build and then place the contents of abcd-client/build in your webserver's content directory, e.g., cp build/* /some/directory/.
To run an nginx web server, assuming the build files are in /some/directory/ and the data files in /some/directory/data/ then run
docker run --name nginx-data -d -p 80:80 -v /some/directory:/usr/share/nginx/html:ro nginx
Coming soon
- Dylan Nielson
- Thomas Frohwein
- Georgi Ivanov
- Tom Panning
- Rebecca Waugh
- Kat Small
- Anna Kondylis
- Adam Thomas
The aggregations for all possible plots are pre-calculated in the abcdqc_batchserver and served as files from within the webserver. The file names describe what filters were applied before calculating the aggregations. For instance, the aggregations for scans made with just a GE scanner are stored in Manufacturer-GE.json.
The files are formatted as JSON objects where the top-level keys are the names of the IQMs. Inside the IQM are various statistics. The kde field is an array of coordinates. Each coordinate is an array of two values, where the first is the metric value (the y-axis on a violin plot) and the second is the density (width of the violin plot). Example JSON structure:
{
    efc: { // IQMs at the top level
        boxplot: {
            quartiles: [.1, .55. .7]; // general stats
            extremes: [.05, .9],
        kde: [ // then an array of the KDE curve values
            [.5, 10], // first element is the metric value, second element is the density (width of the violin)
            [.6, 20]
        ]
    }
}
This project is listed on FAIR Shake and has a Zenodo DOI for citation:
