AirWaves is a website monitoring tv reception signals in the Greater Boston Area. This website utilizes the Plotly JS and Python graphing libraries to explore relationships between signal strength, signal quality, and symbol (picture) quality and weather conditions for real channel frequencies.
Frequencies recieved by an antenna are run through an HDHomeRun Connect Duo tuner. These frequencies (signal measurements) are fetched from the tuner's API and stored on a database maintained on our server. AirWaves reads signal measurements and weather data from this database.
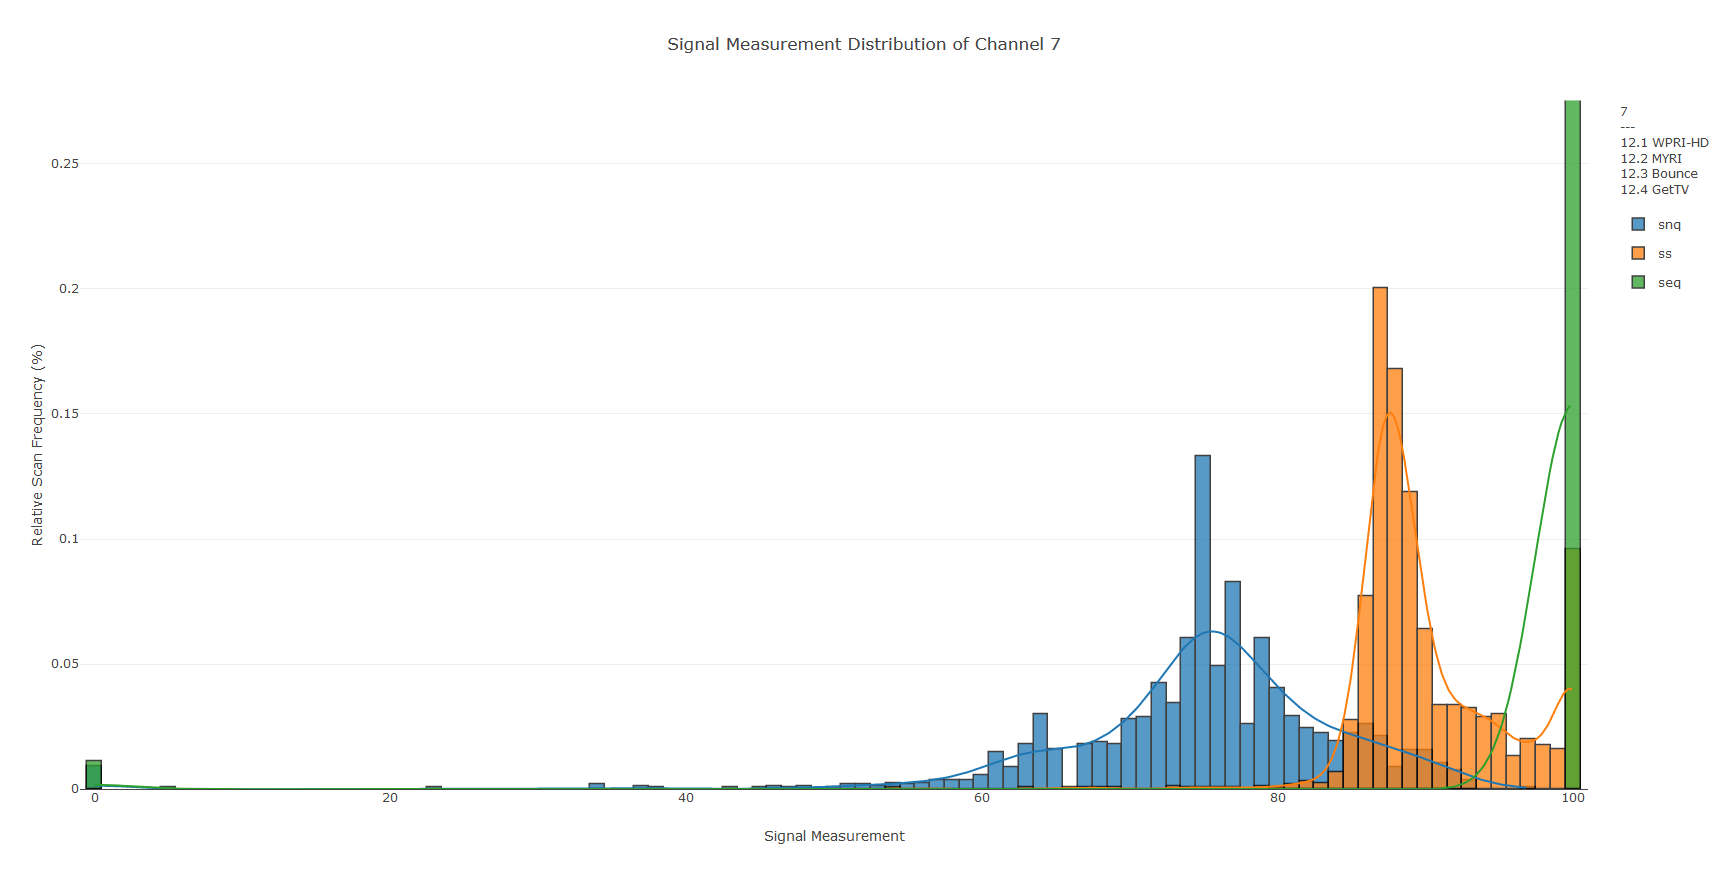
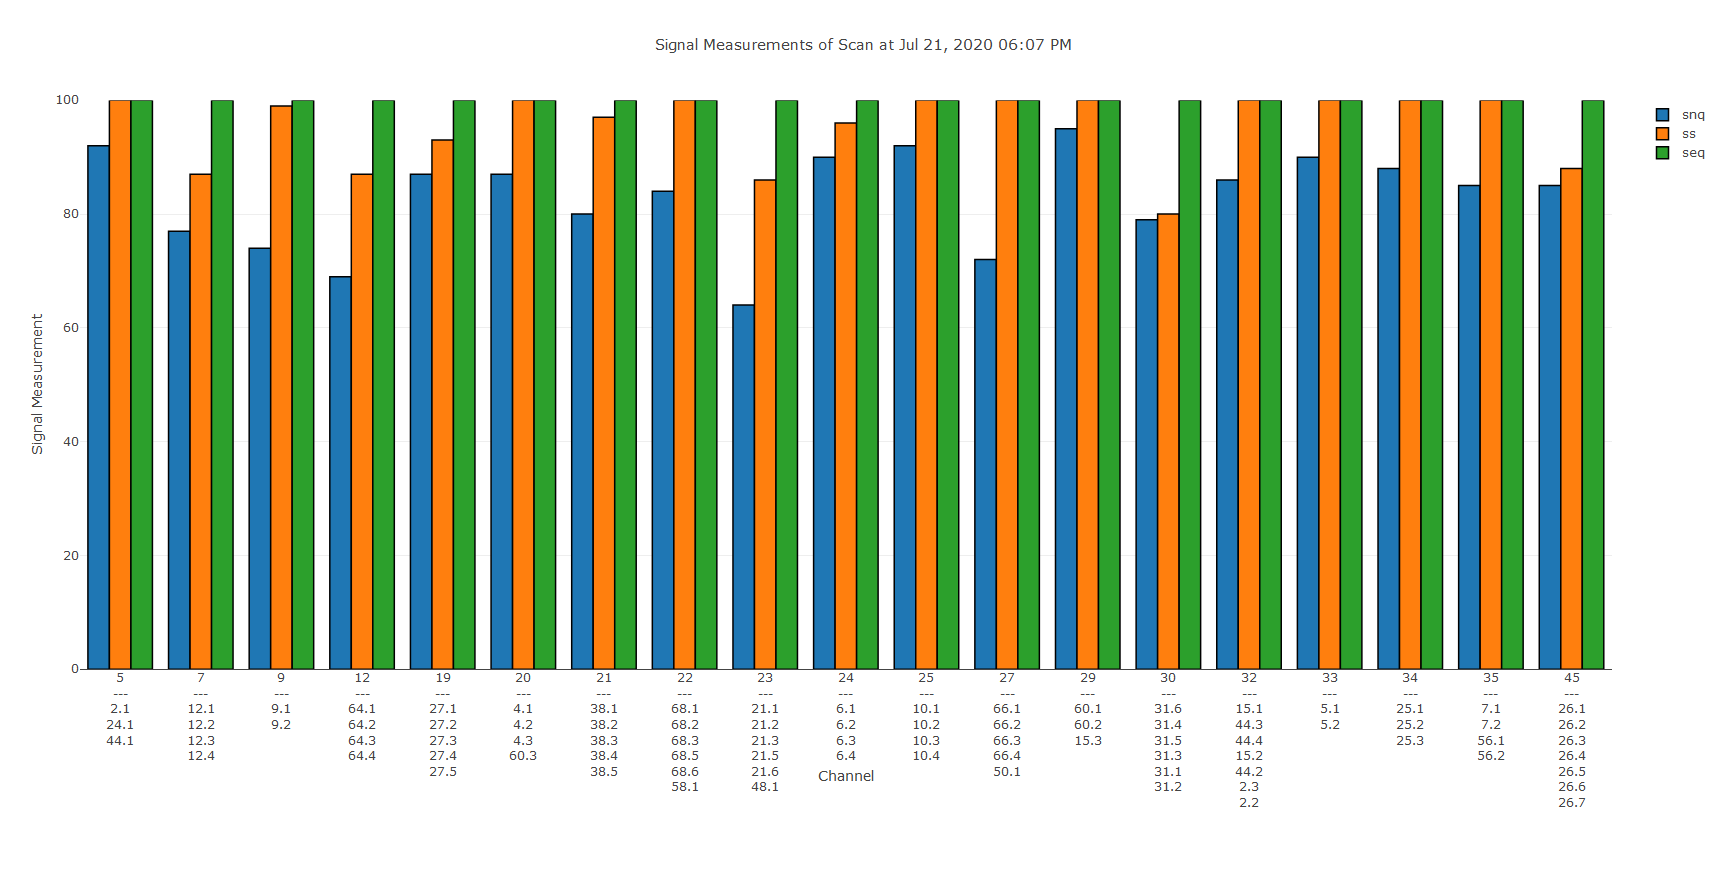
AirWaves offers three main services: Track Channel, Channel Distribution, and Scan Summary. There are three types of signal measurements monitored by a HDHomeRun tuner: signal strength (ss), signal quality (snq), and symbol (picture) quality (seq). HDHomeRun provides an overview of what these mean and how to use them here. tl;dr: Signal quality best describes a signal's clarity, signal strength is somewhat irrelevant, and picture quality is either 0 or 100, with 100 indicating a watchable signal and 0 a static signal.
These signal measurements are monitored and recorded for each real channel picked up by the antenna. Virtual channel numbers are mapped to each real channel, hence their grouping in channel labels. Further reading on real channels can be found here, and virtual channels can be found here. Channel labels are composed of real channels and all virtual channels and their stations that map to it.
Plotting Channel Signal Measurements Over Time. Link changes in signal measurements to weather conditions.

Plotting Signal Measurement Distributions for Various Channels. View the signal measurement distribution of tv reception for your weekly programs via the filter button
Plotting Channel Signal Measurements for an Individual Scan. View the latest scan data in more detail.
AirWaves also provides an API for the three services described above. Here, you can query the existing reception data based on the following parameters.
Track Channel:
| Parameter | Description |
|---|---|
| antenna | The desired antenna instance |
Channel Distribution:
| Parameter | Description |
|---|---|
| channel | The desired real channel number |
| antenna | The desired antenna instance |
| model | The desired model type (kde or normal) |
| histnorm | The frequency distribution ("probability" for percents or none (don't include this parameter) for counts) |
| tod | The time of day (use this parameter twice: the first is the start and the second is the end hour) This only works if the time range is all within one day (12 AM to 12AM) for hours like 9PM to 8AM use the inversetod parameter |
| inversetod | Set to true for tod hours that aren't within one day (i.e. 9PM to 8AM) |
| daterange | The date range of the scans (unix timestamp with a GMT-04:00 timezone) (use this parameter twice: the first is the start and the second is the end timestamp) |
| temp | The temperature range (in Farenheit) of the scans (use this parameter twice: the first is the start and the second is the end temperature) |
| windspeed | The windspeed range (in mph) of the scans (use this parameter twice: the first is the start and the second is the end wind speed) |
| winddirection | The wind dirction range (in degrees) of the scans (use this parameter twice: the first is the start and the second is the end number of degrees) |
| humidity | The humidity range (%) of the scans (use this parameter twice: the first is the start and the second is the end percentage) |
| weatherstatus | The weather status (get possible weather status values for an antenna instance here Use the antenna parameter to request the desired antenna instance) |
Scan Summary:
| Parameter | Description |
|---|---|
| scantime | The desired scan time (unix timestamp with a GMT-04:00 timezone) The scan closest to the desired time will be used |
| antenna | The desired antenna instance |
AirWaves started as a way to determine the effects of solar panels on TV reception via an antenna. After their installation, the solar panels produced visible effects on VHF channels:
Before Installation:

After Installation:
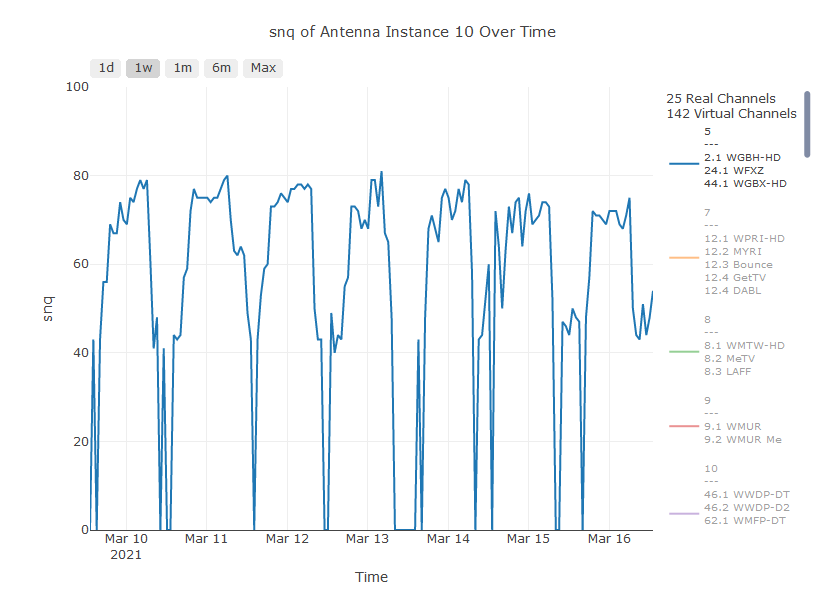
As can be seen in the graph, the signal quality is poor during the day (when the sun is up) and strong during the night (when the sun is down). The signal quality is so poor during the day that the signal, at times, cannot be deciphered, as seen with the picture quality graph below.
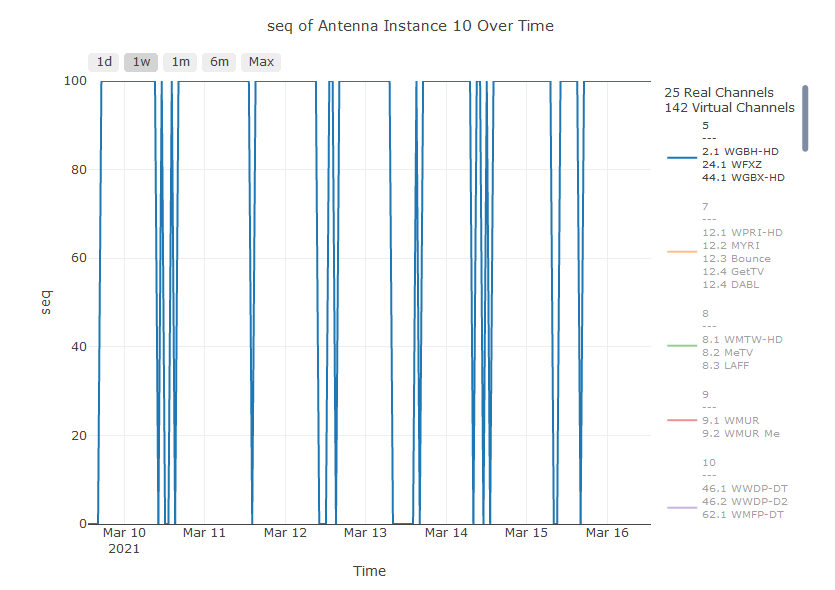
Note: A seq value of 100 means the signal is watchable, while a value of 0 means that it cannot be watched (static)
This data suggests that solar panels, when generating electricity, interfere with the radio waves and yield worse TV reception for VHF channels.
| Browser | Version |
|---|---|
| Firefox | 78.0.2 |
| Chrome | 83.0.4103.112 |
| Microsoft Edge | 44.18362.449.0 |
| Safari | 13 |