
A simple tool for making banana plots from several multi-dimensional point datasets.
The term banana here refers to the usual shape of the contours of two feature projection of the datasets. See the gallery to see the graphical motivation.
We'd like a tool to drive matplotlib. Declarative.
The distribution of points are internally modelled with a gaussian mixture model.
Gallery (Plots that shall be able to make)
https://docs.google.com/document/d/13h6d35Ily_QobpCk3xNivwm4WW_b36pTXpNITnFWPOo/edit?usp=sharing
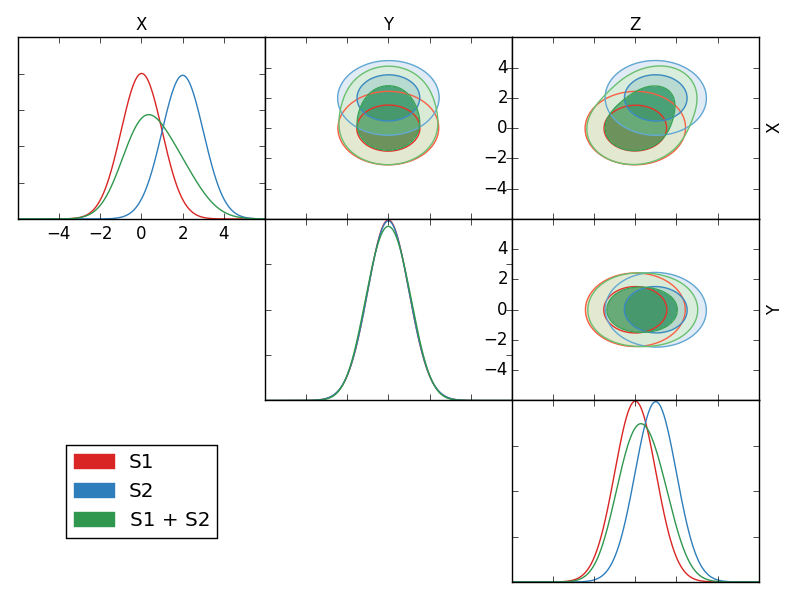
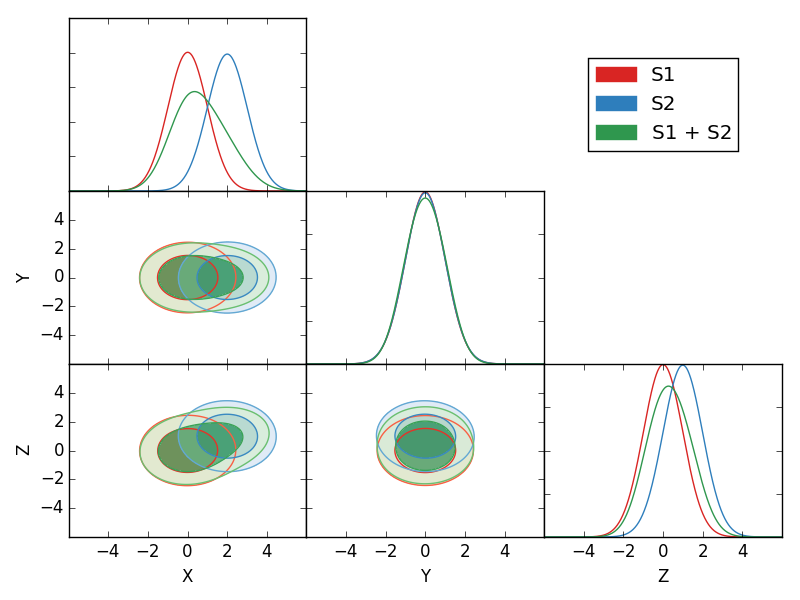
Here is an example code:
https://github.com/bccp/bananaplots/blob/master/bananaplots/tests/test_bananaplots.py#L15
which produces the following two figures.
This is an ongoing work.
Martin White suggested the project in August of 2016.
Yu Feng discussed the project as an Hack at the AstroHackWeek 2016 with Brigitta Sipocz, Dan Foreman-Mackey, and Jake VanderPlas.
Three major outcomes:
- Histograms capture tails much better than mixture of gaussians. We currenlty do not support histograms.
- if we can model the MCMC as a mixture of gaussian, then there probably is a easier way to model the likelihood than running MCMC.
- In addition, we shall explore a declaritive way of describing a plot that supports more complicated modelling. Vega-Lite does not appear to support this.
The scaffold of the project is roughly based on https://github.com/kbarbary/greeter but we use runtests.py from numpy c.f. kbarbary/greeter#8