Welcome, my name is Èric Canela and I'm a student of 2nd Year of UPC Tech Talent Center from Barcelona under supervision of the lecturer Ricard Pillosu on the 2nd Year Project subject. Today I will introduce you an interesting and useful guide about Static Analysis and I will explain why you should use it when developing any game or application.
When we are developing a program there is a lot of pressure and sometimes the timelines are too heavy, and the developers can’t ensure a good quality on the code, creating more bugs and slowing down de current development. To ensure that this do not happen, exist some amazing tools to make it easier and avoid possible problems in the future.
First of all let’s talk about the concept of Static Code Analysis.
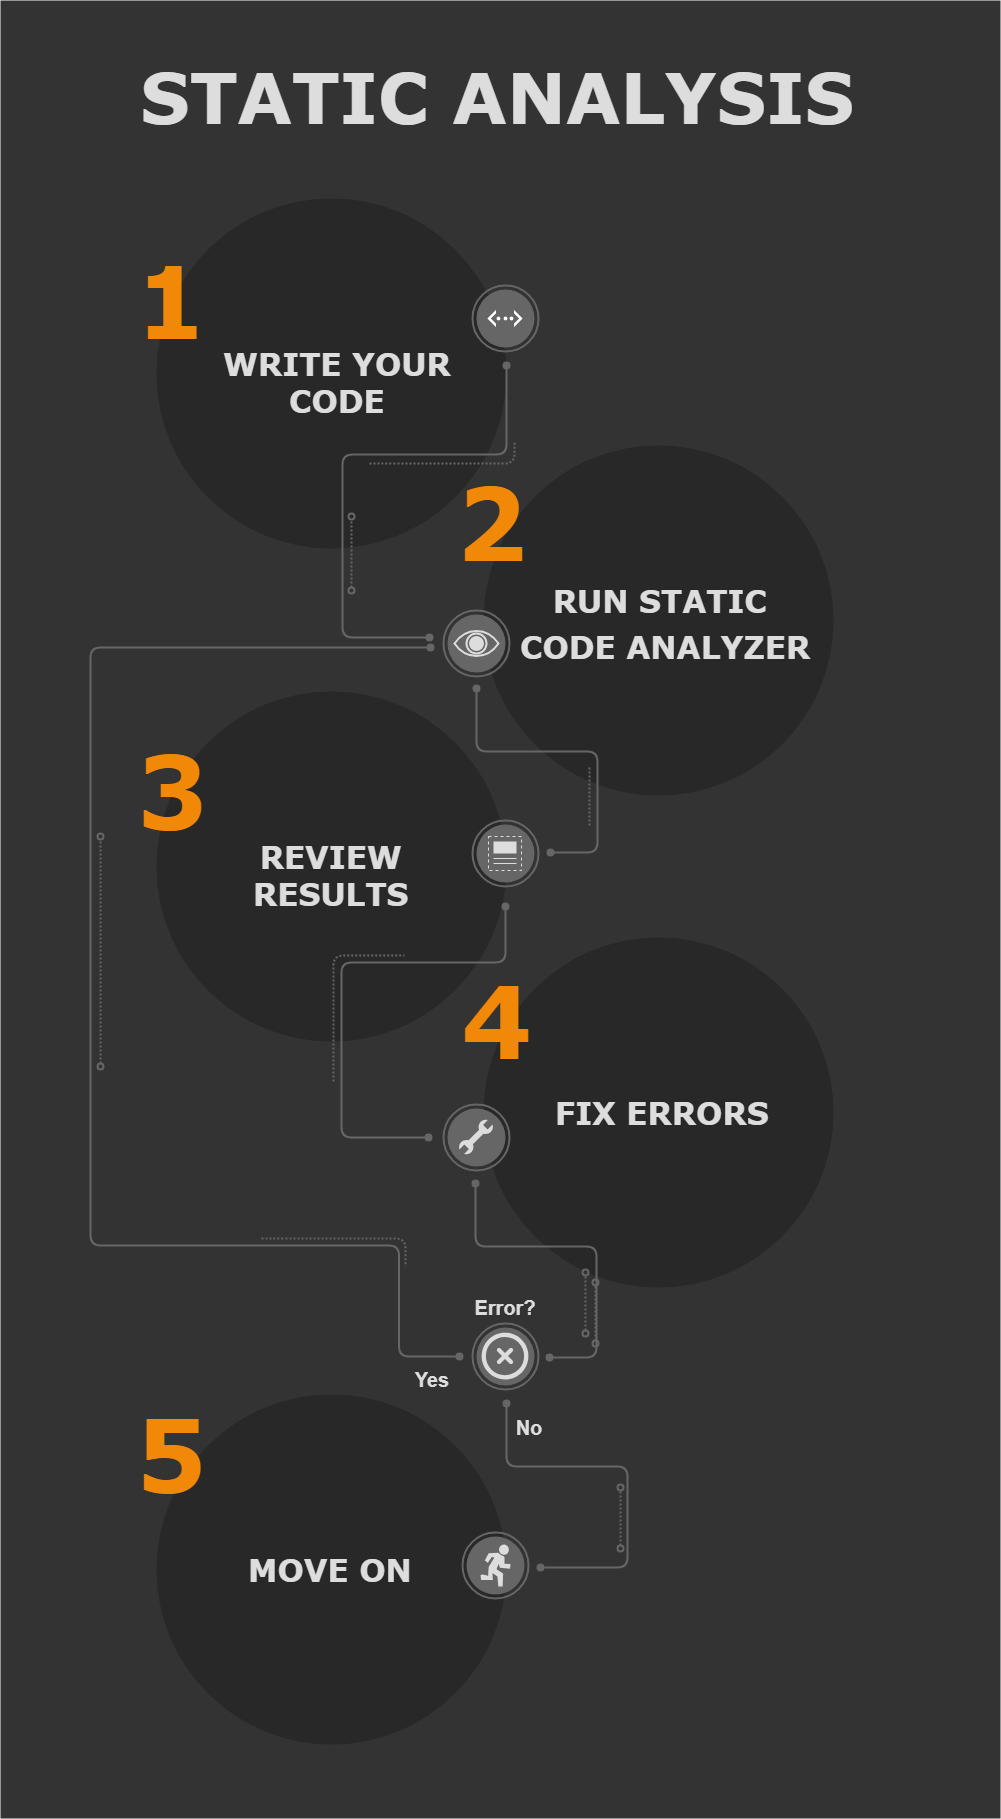
It is a method of debugging with a computer program by examining our code without having to run the program. This process provides us some feedback to find programming faults and display it to the developers. This analysis is made against a set of multiple coding guidelines to ensure the quality on the code with the current standards on the industry.
 |
 |
| Misra | ISO26262 |
Quality Standards
It uses different methods to detect these errors, which are:
- Pattern-Based Static Analysis: It looks for predefined patterns in the code and detects if they are used and reports them as a possible error.
- Data Flow Analysis: It checks for problematic constructions against a set of rules and detect errors such as null pointers and buffer overflows.
- Control Flow Analysis: It is an abstract representation on the software that aims to determine the order of instructions separated in blocks and the execution order.
- Taint Analysis Detects variables that could be modifiable externally, and be used in functions that could compromise the security of the application, E.g. SQL injection.
|
Static Code Analysis |
|
|
Advantages |
Limitations |
|
It can find weaknesses in the code at the exact location. |
Time-consuming if conducted manually. |
Problems detected earlier in the production phase |
Production of false positives and false negatives. |
|
Allow to fix the problems earlier |
Need too much personal to do the tests |
|
Fast development cycle if automated tools are used. |
Do not find all the problems |
|
Unreachable Code |
Only detect problems stipulated by the quality guidelines |
|
Variable Use(undeclared, unused) |
Do not find vulnerabilities in the runtime environment |
|
Uncalled functions |
It can take dome time analyzing |
During an early stage, the creation phase, just before the unit tests. Using it in this stage allow us to detect a possible vulnerability or bug that can cause a future problem and be harder to remove it, if we had find it in an early stage.
A peer developer, someone other than the developer who wrote the code, should do these tests.
- Reliability
- Maintainability
- Portability
- Efficiency
Now that we know what is the Static Analysis, we might think about which tools there are on the market. We can find Premium tools, which will give us more features and support by a moderate prize, or in the other hand, Open Source and Free tools that might be more limited.
These are some of the best tools you can find:
 |
 |
 |
 |
 |
| PC-LINT | Helix QAC | Code Sonar | Visual Studio | Goanna |
 |
 |
 |
 |
 |
 |
| Cpp Check | BSS Lint | Parasoft C/C++ test | Eclipse | Frama-C | Clang |
The tools above are compatible with C/C++. Also, if you do a little of research, you’ll find a lot more but probably you might ask “Which tool should I select?”.
Here are some basic tips for you, to select the best one for your project:
- Must support your programming language.
- Which and how many vulnerabilities can detect.
- Can it be integrated into the developer's IDE?
- How much it cost the tool, is it Free?
- Does it support Object-oriented programming?
We are going to use CppChecker as the static code analysis tool. This is because the low rate on finding possible false positives and negatives. But it is strongly recommended to use more than one, to detect all possible errors that one tool couldn't find.
We can use between two versions:
The analyzer is thought to be used in the command line, but thanks to a plugin for Visual Studio, we will be able to see it with the interface of the Visual Studio and interactuate with the errors detected.
With the GUI version, it will allow us to see everything much better with a clean interface. But this version has a big problem, the current version hasn't implemented all functionalities of the command line or plugin version. Even that, it will work for the main purpose of identifying the errors in the code.
Follow these steps to configure the Add-on for Visual Studio or the GUI version:
To use the addon first you will have to download CppCheck and install on your computer
Download and Install the .exe from the Official Website, compatible with the version of your SO.
Download the add-on from this Repository link and install it.
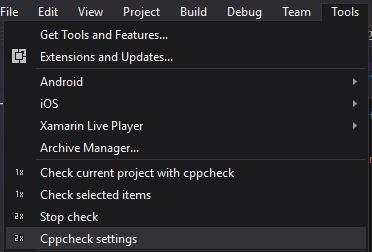
Open Visual Studio and you will notice that has been added new features in the "Tool" section. Click on the Tools -> Cppcheck settings
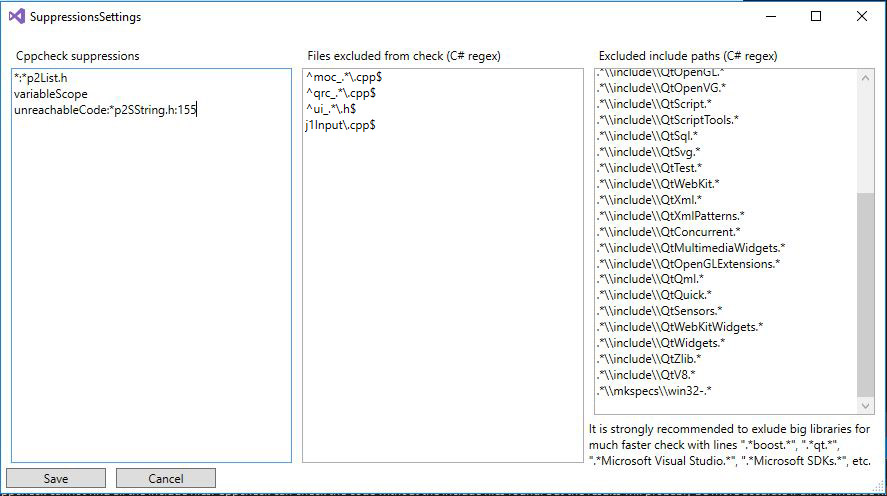
It will appear the next screen, set the same configuration as the next image.
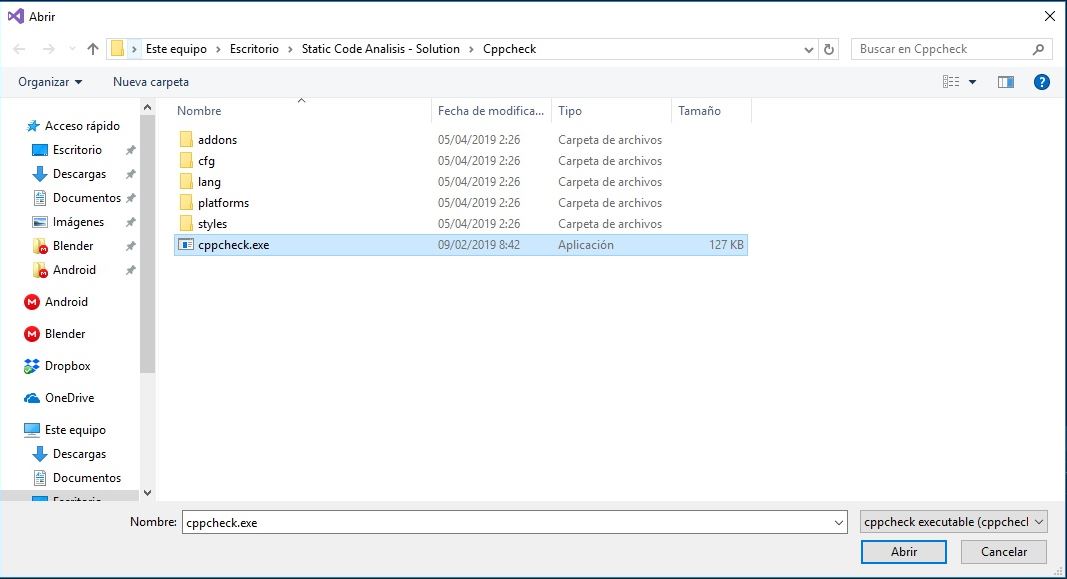
Execute the first scan on your project by clicking on "Tools -> Check current project with cppcheck". It will ask you to find cppchecker.exe, it whould be in "C:\Program Files\Cppcheck".
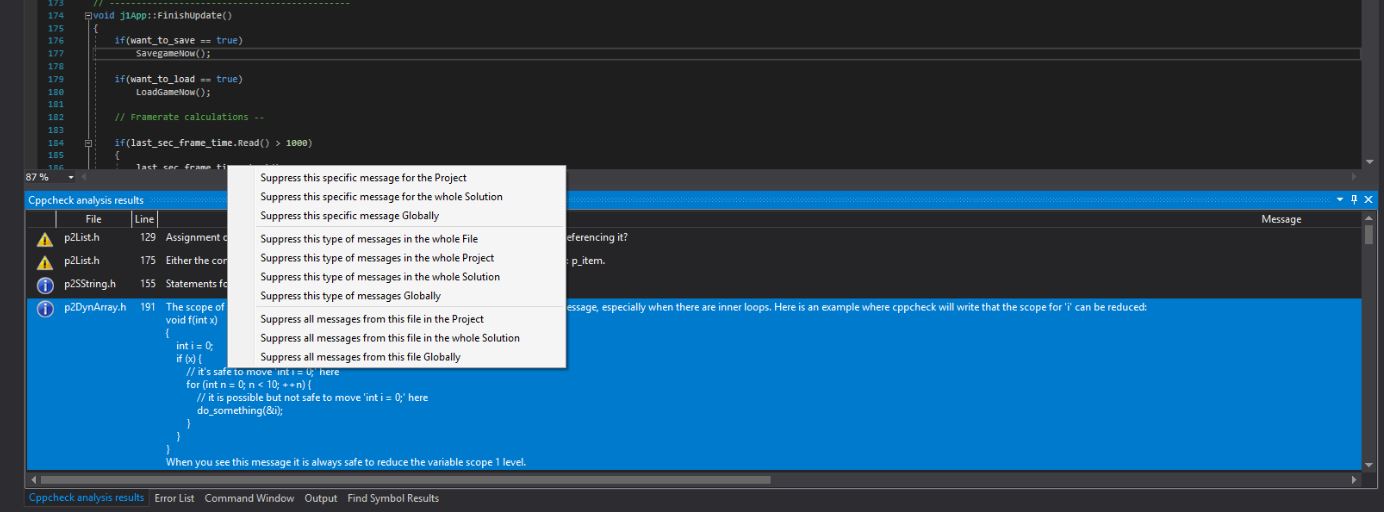
You will see that has appeared a new tab at the bottom named "Cppcheck analysis results". Here will appear the warnings and errors that you have in your code and has to be fixed.
To add filters and avoid some errors to appear, you only need to right-click on the message and it will appear some options, select the one that you need.
To filter libraries or other files and avoid the analyzer to check them alway you execute the scan, go to "Tools -> Cppcheck settings->Edit Global Supressions.
Here you will see the suppressions that you have added:
-
Cppcheck suppressions: Are all the suppressions/filters that you have activated for the messages, errors/warnings or exact errors in a line of code.
- *:*p2List.h to hide all warnings from the file.
- variableScope will hide all warnings from this rule, you can check all the possible rules in this link.
- unreachableCode:*p2SString.h:155 will hide this error from the file p2SString.h at the line 155.
-
Files excluded from check: This will deny the analyzer to scan the file.
- j1Input\ .cpp$ will exclude the file j1Input to be scanned. (IMPORTANT: headers not supported)
-
Excluded include paths: Will exclude the path inserted, very useful for big libraries that don't need to be scanned and make the scan faster.
Once you have configured everything you only need to save and do more tests.
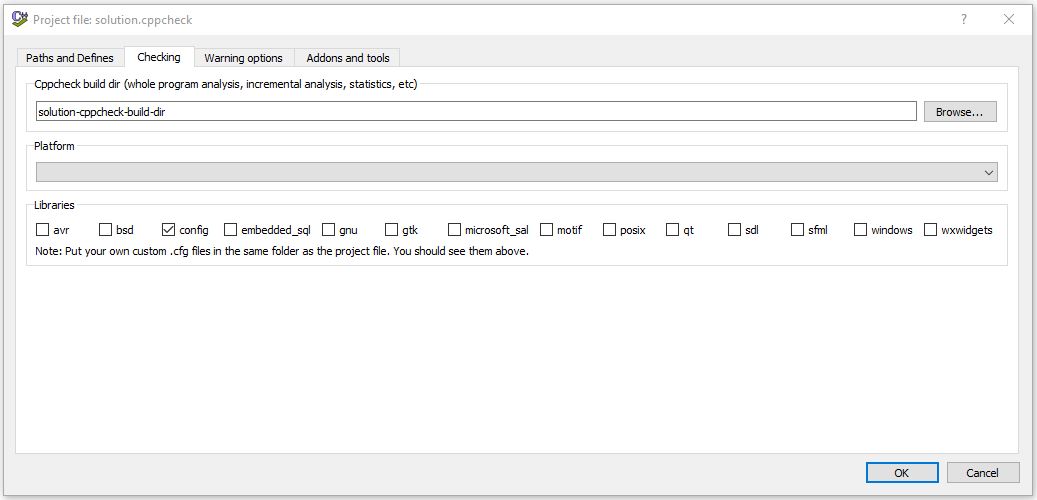
If you want to create your own rules, you will have to do the Steps 9 and 10 of the CppCheck GUI Configuration, and when you create the file, save it inside the cppcheck.exe directory.
Go to "Tools->cppcheck settings" and add the next line inside Additional arguments
--library=config.cfg
Download and Install the .exe from the Official Website, compatible with the version of your SO.
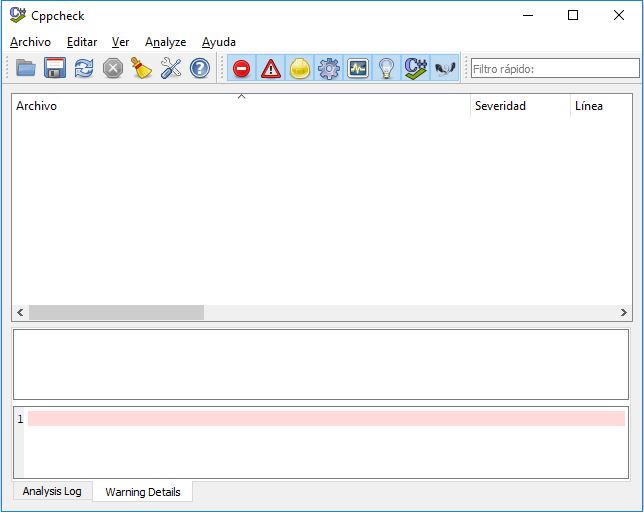
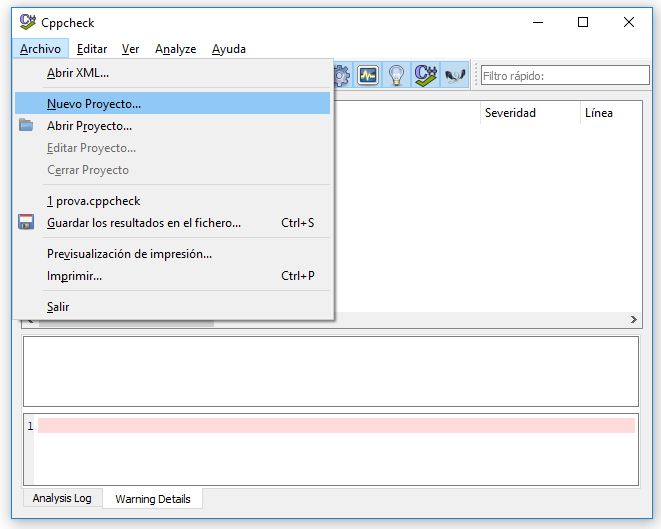
Go to the Installation folder and execute cppcheckgui.exe. It will appear as the image above.
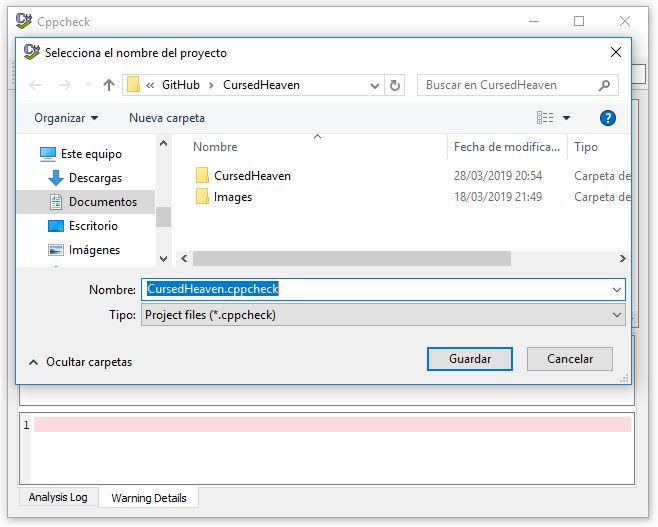
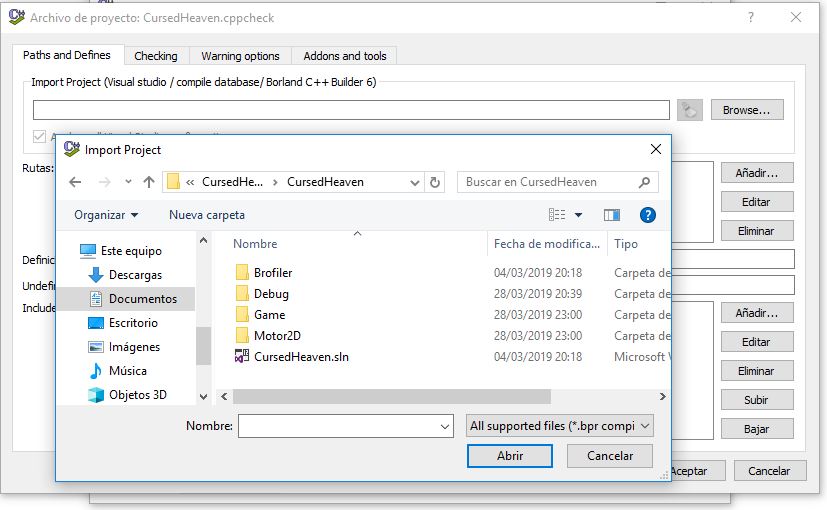
Click on File->New Project, it will ask you where do you want to store the file. I recommend you to put it in the solution folder.
Import the project solution by clicking the top button Browse.
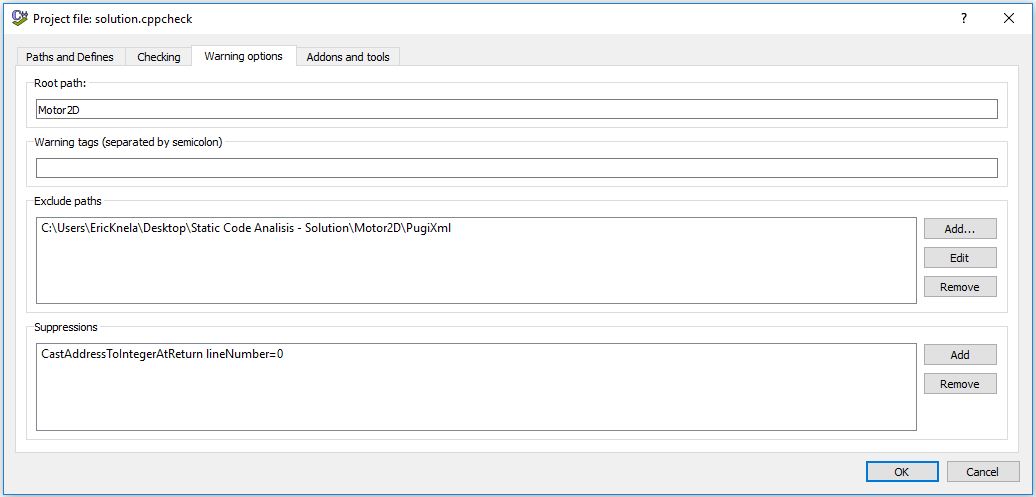
Go to the Warning options tab and select your root path where you have all the files you want to scan. Exclude all the paths that you don't want to be scanned, and add the suppresions needed like messages or other possible filters.
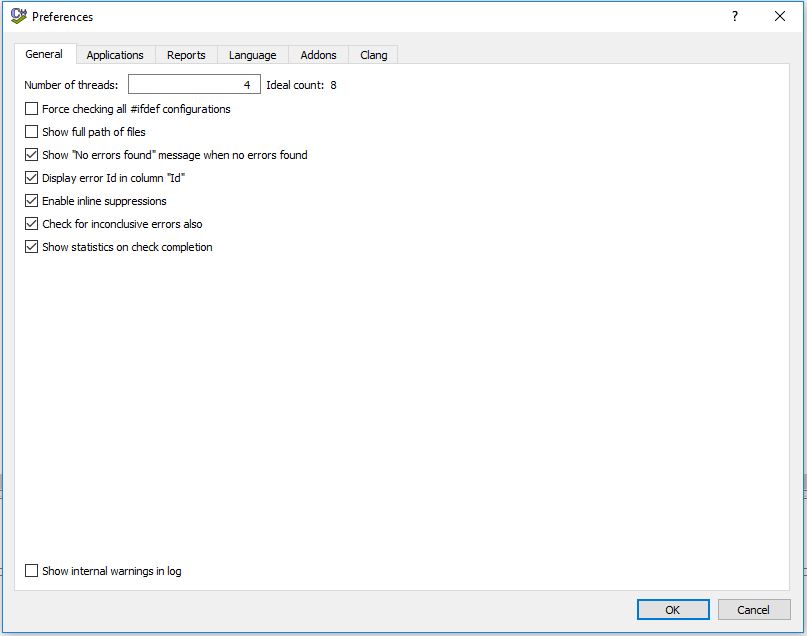
Save all changes and go to "Edit->Preferences" and set the configuration as the image above. This is the basic configuration to find almost all errors in your code.
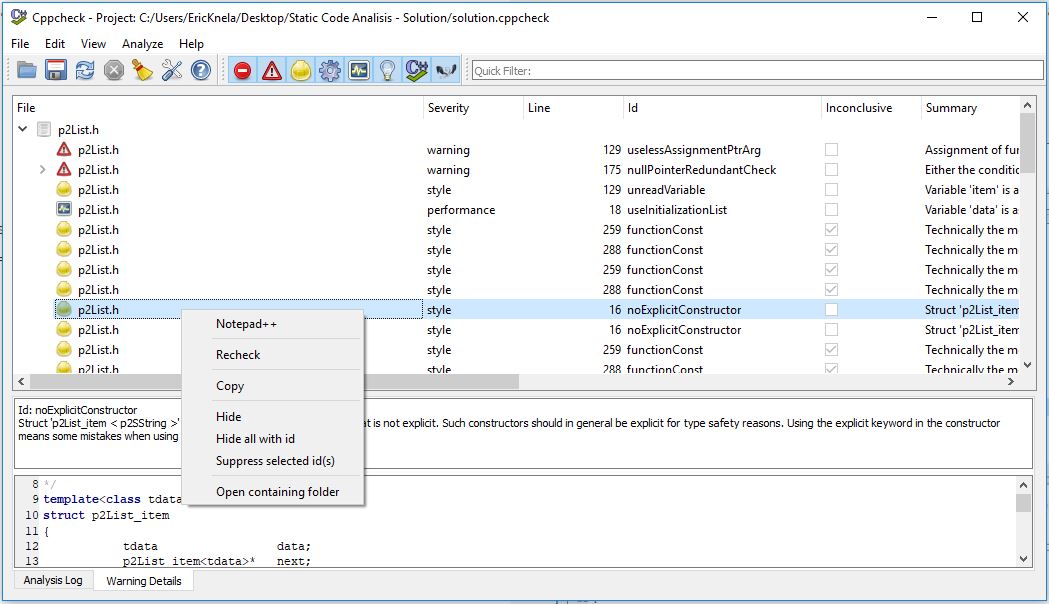
To analyze your project you only need to click on the two blue arrows and it will start scanning. When it is done, will appear a list with all errors detected.
To supress an ID you just have to right-click on the id of the message, and click Supress selected id(s). In this version of CppCheck as I said before, it is limited, to supress a message, you only have the option of suppress by id in the GUI interface.
Create a file named "config.cfg" in the folder where is located your solution and add this line of code
<?xml version="1.0"?>
Go to File->Edit Project->Checking tab" and you will see in the list of checkboxes that has appeared one named exactly as the file, ensure to check it to make the analyzer use your rules.
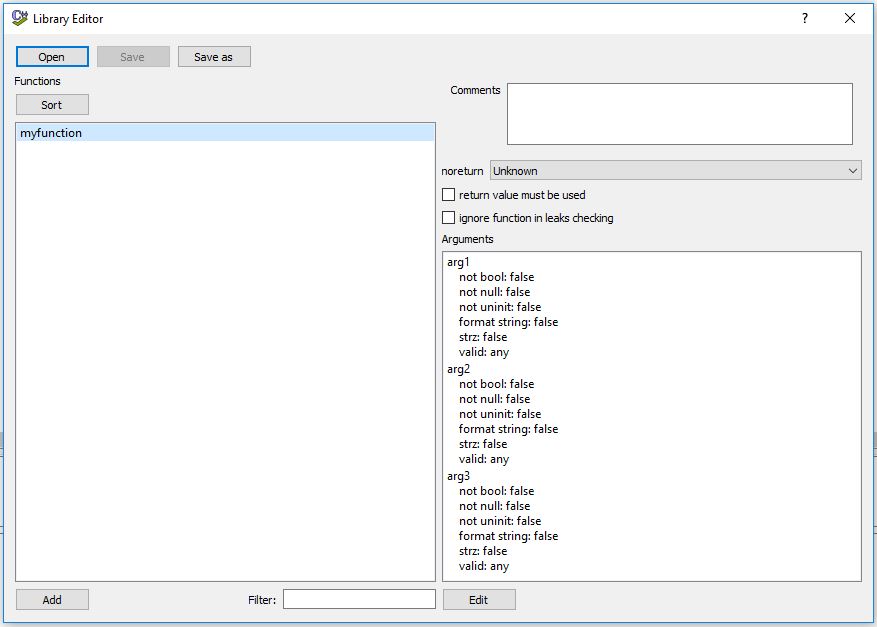
Go to View->Library Editor and open the .cfg you have created. You can create some rules for the functions you insert in this list, saying how many arguments it takes and the expected types they are or if it has to return something or not. If in your code you have the function and it is wrong, it will jump an give you an error.
Download the Handout from the Releases and extract it to start the TODO exercises:
You can check the Solution of these TODOs exercises in the Releases page
Configure the Cppcheck GUI version.
- Suppress the error id funcArgNamesDifferent
- Suppress the error variableScope from line 56 of the j1Scene1.cpp (Recommendation: Use absolute path)
- Exclude the path of PugiXml library
- Exclude j1App files
(Recommendation: Use absolute path)
Fix Pathfinding.h and Pathfinding.cpp.
https://www.perforce.com/blog/qac/what-static-code-analysis
https://www.perforce.com/blog/qac/how-static-code-analysis-works
https://www.owasp.org/index.php/Static_Code_Analysis
https://www.kiuwan.com/blog/static-analysis-in-automated-software-quality-tests/
https://en.wikipedia.org/wiki/List_of_tools_for_static_code_analysis#C,_C++
